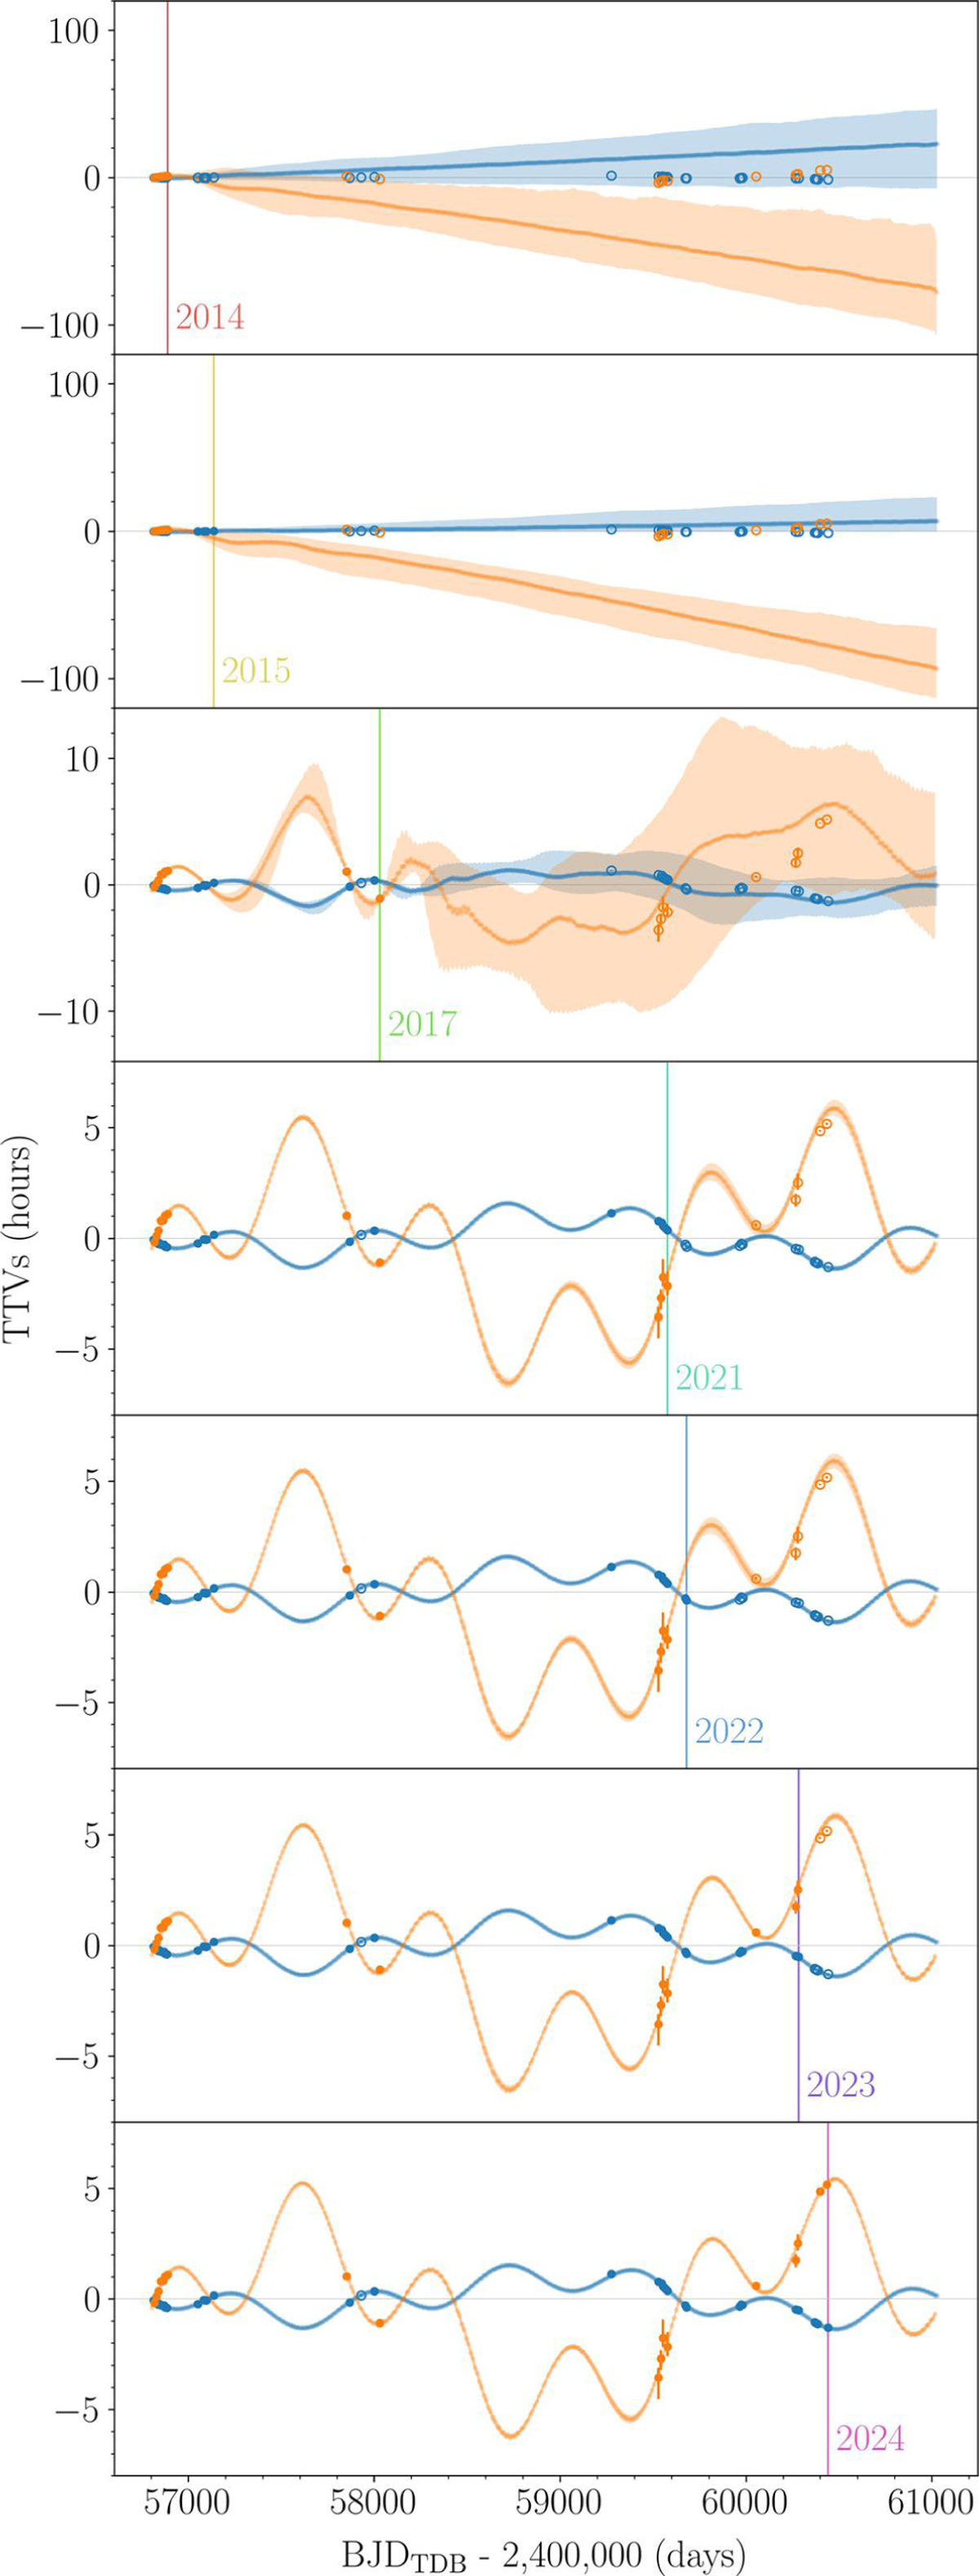
Fig. C.2
Download original image
Same as Fig. 5, but for the analysis using only transit times up to the end of the labeled year and only planets b and c in the model. The labeled vertical line (the color code is the same as in Fig. C.1) marks the last observation modeled. Filled circles represent the times used in the analysis of each of the panels, while open circles indicate observations that are not used.
Current usage metrics show cumulative count of Article Views (full-text article views including HTML views, PDF and ePub downloads, according to the available data) and Abstracts Views on Vision4Press platform.
Data correspond to usage on the plateform after 2015. The current usage metrics is available 48-96 hours after online publication and is updated daily on week days.
Initial download of the metrics may take a while.