Fig. 3
Download original image
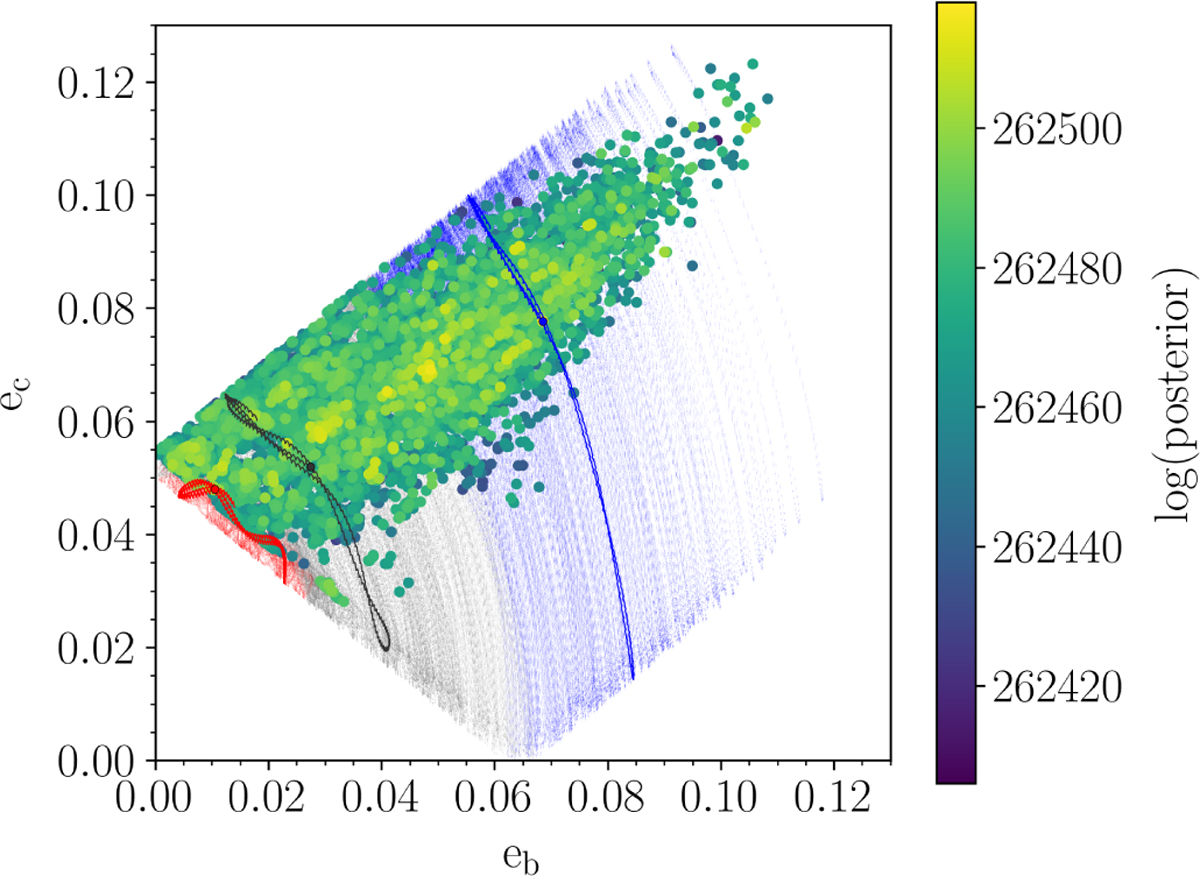
Correlation of the eccentricities of K2-19 b and K2-19 c. The dots represent the posterior samples at tref, and the color scale shows their log-posterior value. The evolution during the observations for 1000 random draws from the posterior distribution is shown in light gray (black for a random sample), light red (red for a random sample), and light blue (blue for the MAP model). The color coding depends on whether ϖb − ϖc circulates, librates around π, or librates around zero (the same scheme as in Fig. 4). The blue dot represents the MAP model values at tref (and from there, it starts to move upward), and similarly for the two random samples in red (left) and black (upward). Section 5.4 discusses the shape of the domain and resonance angle behavior.
Current usage metrics show cumulative count of Article Views (full-text article views including HTML views, PDF and ePub downloads, according to the available data) and Abstracts Views on Vision4Press platform.
Data correspond to usage on the plateform after 2015. The current usage metrics is available 48-96 hours after online publication and is updated daily on week days.
Initial download of the metrics may take a while.