Fig. 4
Download original image
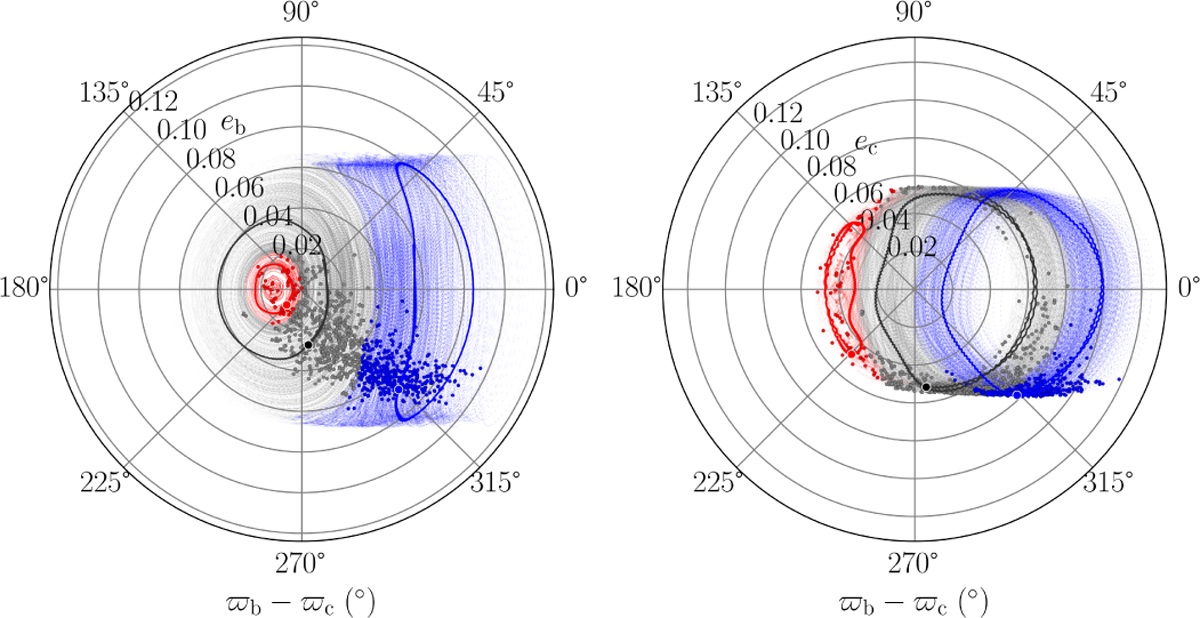
Correlation of the eccentricity of K2-19 b (left panel) and K2-19 c (right panel) with the difference in the longitudes of periastron over the time span covered by the observations for 1000 random draws from the posterior distribution. Samples that circulate are shown in light gray (one random sample is shown in black), those that librate around ϖb − ϖc = 0° are shown in light blue, and those that librate around ϖb − ϖc = 180° are shown in light red (one random sample is shown in red). The MAP model, which librates around 0, is shown in blue. The dots, with the same color code, represent the positions at tref.
Current usage metrics show cumulative count of Article Views (full-text article views including HTML views, PDF and ePub downloads, according to the available data) and Abstracts Views on Vision4Press platform.
Data correspond to usage on the plateform after 2015. The current usage metrics is available 48-96 hours after online publication and is updated daily on week days.
Initial download of the metrics may take a while.