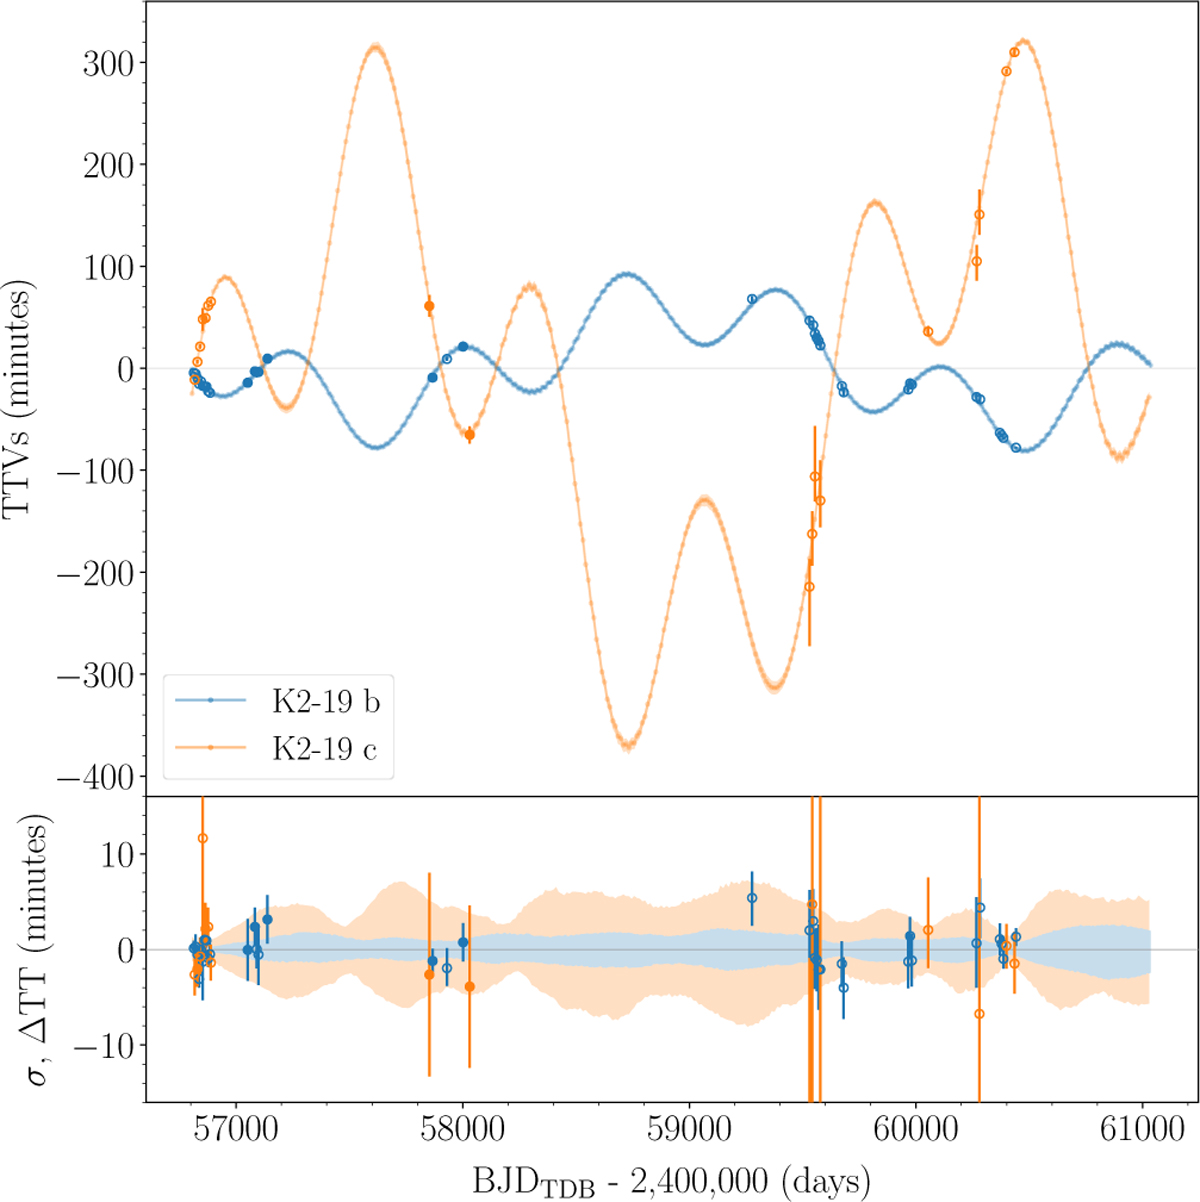
Fig. 5
Download original image
Posterior TTV predictions of K2-I9b (blue band) and K2-19c (orange band) computed relative to a linear ephemeris (2456813.386969 + 7.9209002 × epoch [BJDTDB], 2456817.280436 + 11.8983248 × epoch [BJDTDB] for planet b and c, respectively). We used 1000 random draws from the posterior distribution to estimate the TTV median value and its uncertainty (68.3% CI). In the upper panel, the posterior TTV values are shown and compared with individual transit-time determinations (Appendix B, open and filled error bars). The filled error bars were used as data in the modeling. In the lower panel, the posterior median transit-timing value was subtracted to visualize the uncertainty of the distribution. The posterior median transit time was also subtracted from each observed epoch for the individual transit-time determinations to allow a better comparison with the posterior of the photodynamical modeling.
Current usage metrics show cumulative count of Article Views (full-text article views including HTML views, PDF and ePub downloads, according to the available data) and Abstracts Views on Vision4Press platform.
Data correspond to usage on the plateform after 2015. The current usage metrics is available 48-96 hours after online publication and is updated daily on week days.
Initial download of the metrics may take a while.