Fig. 6
Download original image
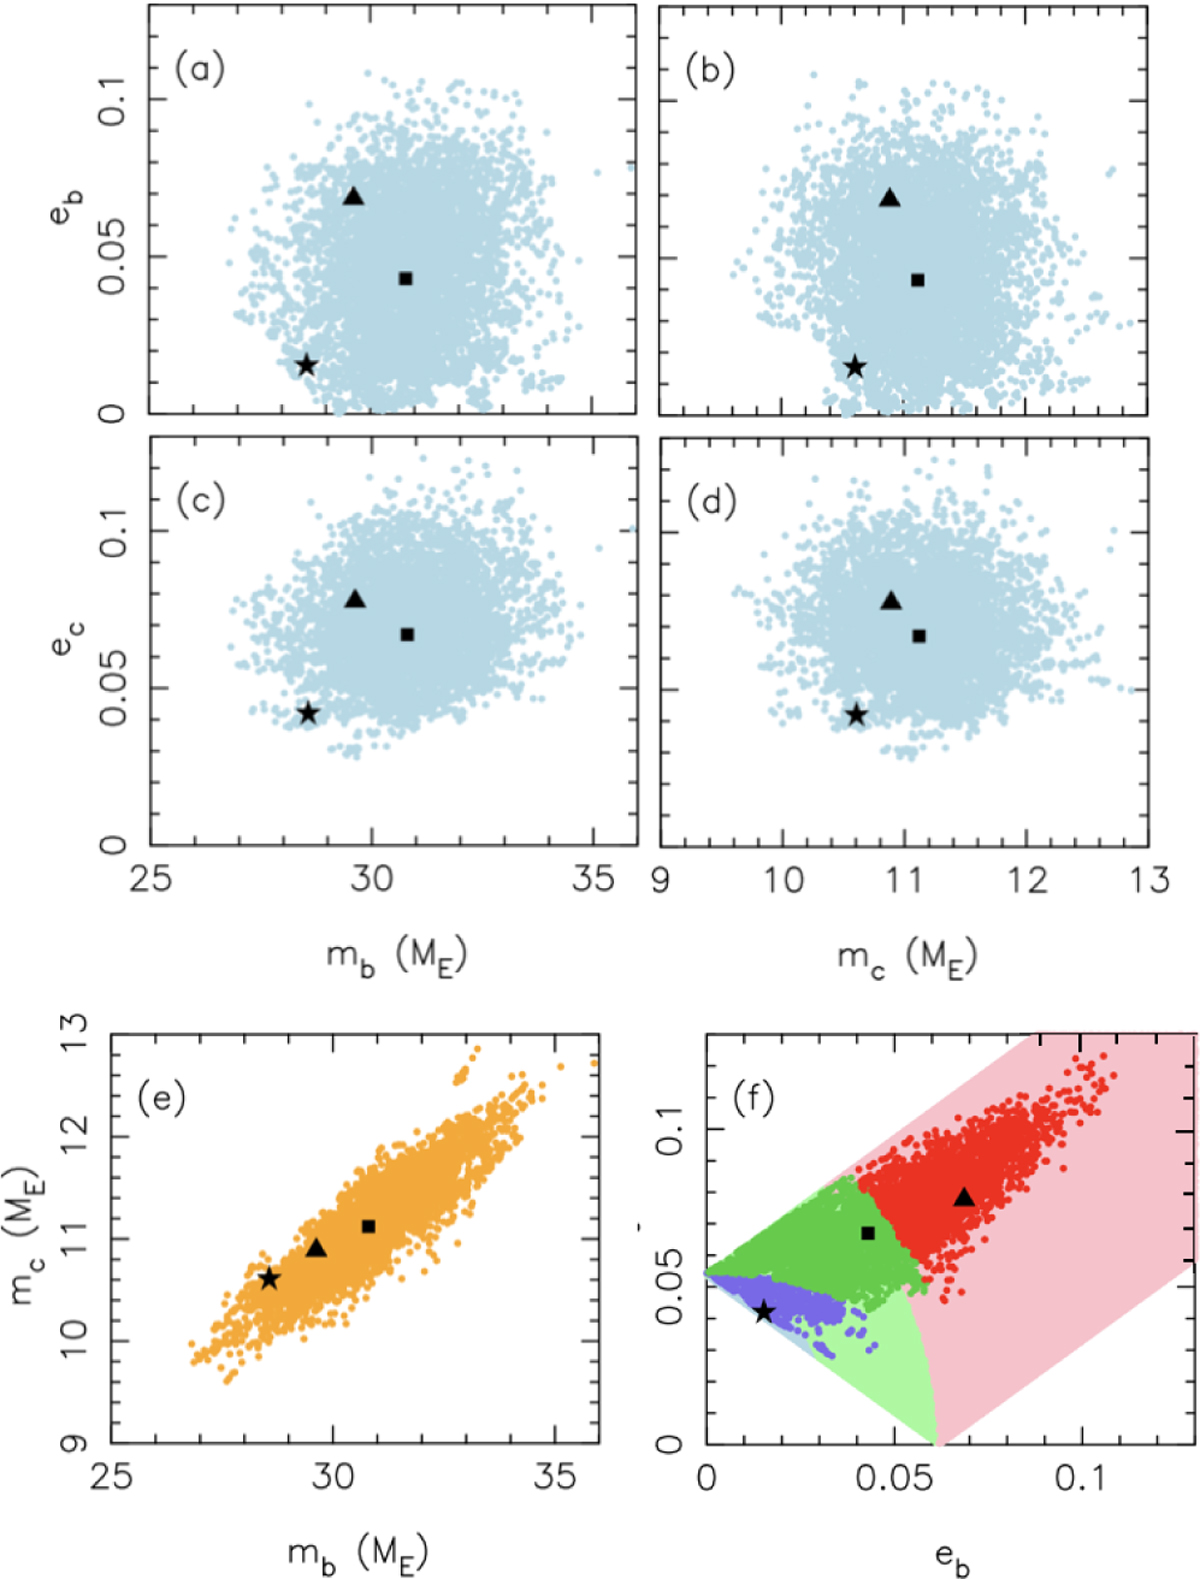
Posterior projections of the mass and eccentricity distributions. They demonstrate that the eccentricities and planet masses are hardly correlated (panels a-d), while the planet masses themselves are correlated (panel e), as are the eccentricities (panel f). The color scheme in (f) is purple for when both resonance angles librate such that ϖb − ϖc ≡ Δϖ librates around π; green for when ϕ1 circulates and ϕ2 librates so that Δϖ circulates; red for when both resonance angles circulate such that Δϖ librates around zero; and pink and light green for the possible values of the eccentricities given the MAP value of u and arbitrary values of v. The true resonance angle ψ librates with a small amplitude around zero for all posterior solutions (Sect. 5.4 and Fig. 8). The stars indicate the posterior sample closest to the fixed-point eccentricities, and the squares and triangles indicate the median and MAP values, respectively. Fig. A.2 shows the projections of the other parameters.
Current usage metrics show cumulative count of Article Views (full-text article views including HTML views, PDF and ePub downloads, according to the available data) and Abstracts Views on Vision4Press platform.
Data correspond to usage on the plateform after 2015. The current usage metrics is available 48-96 hours after online publication and is updated daily on week days.
Initial download of the metrics may take a while.