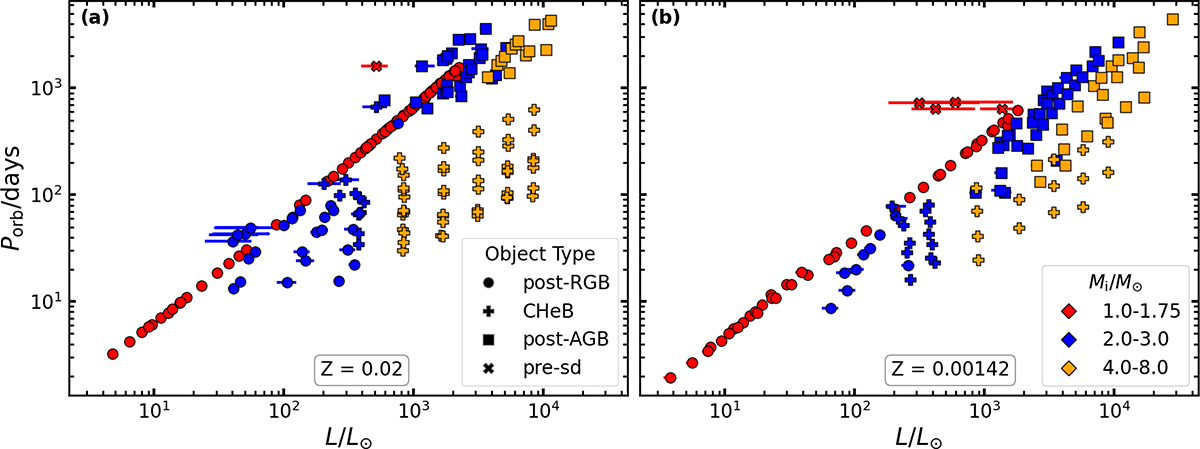
Fig. 4.
Download original image
Orbital period–luminosity diagram of the donor stars in our models following stable mass transfer with effective temperatures in the range of 4000 − 8500 K, colour-coded by initial primary mass. Panel (a) corresponds to the solar metallicity grid, and panel (b) to the metal-poor grid. For those models that do not exhibit constant luminosity after mass transfer, the lines depict the variation in luminosity as the model traverses the effective temperature range, with the markers denoting the time-weighted average of the corresponding evolution. Different markers denote the type of post-mass-transfer donor: post-RGB, central He-burning, post-AGB, or pre-subdwarf (pre-sd).
Current usage metrics show cumulative count of Article Views (full-text article views including HTML views, PDF and ePub downloads, according to the available data) and Abstracts Views on Vision4Press platform.
Data correspond to usage on the plateform after 2015. The current usage metrics is available 48-96 hours after online publication and is updated daily on week days.
Initial download of the metrics may take a while.