Open Access
Fig. 5.
Download original image
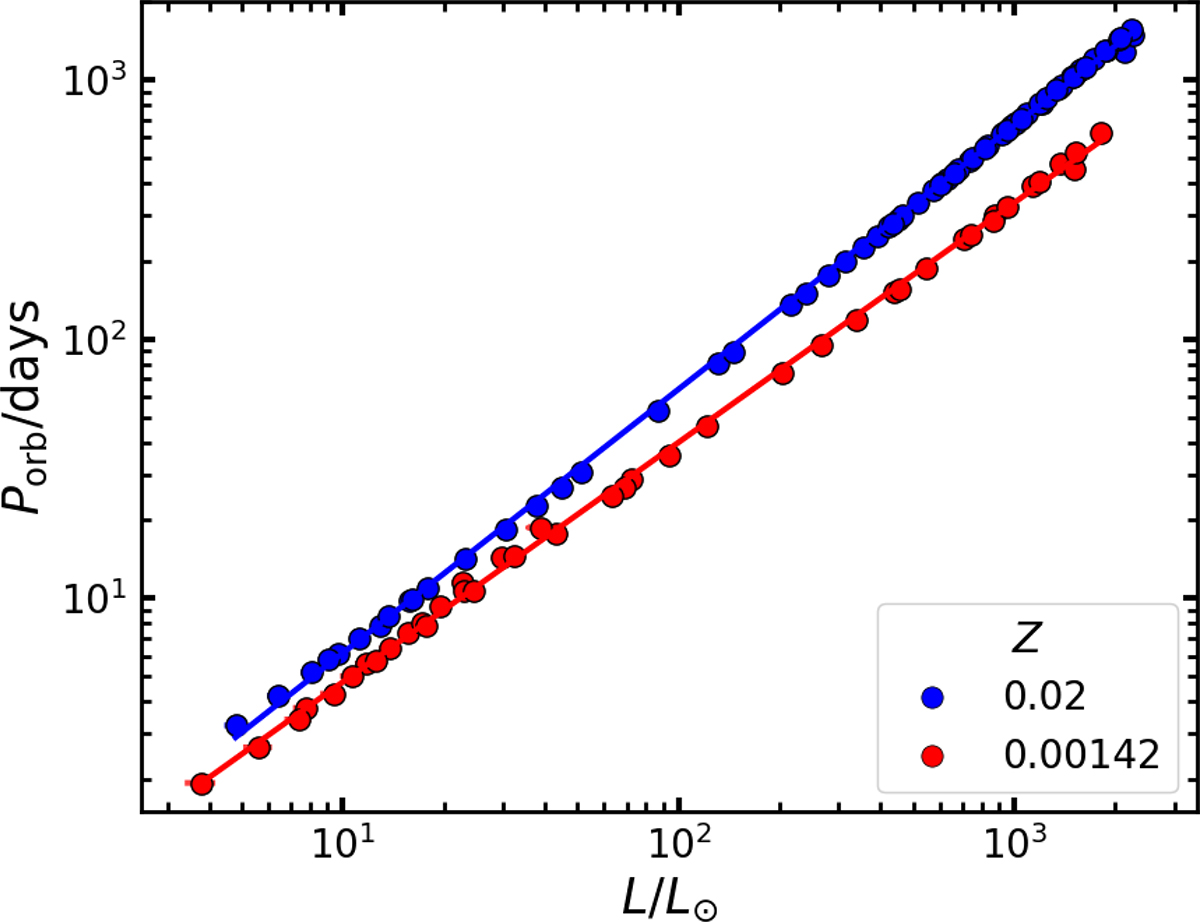
Orbital period–luminosity plot of our post-RGB models with initial primary masses below 2.0 M⊙, indicated by markers and colour-coded by metallicity. Corresponding fits for the solar and metal-poor grids, given in Eq. (1), are denoted by solid lines.
Current usage metrics show cumulative count of Article Views (full-text article views including HTML views, PDF and ePub downloads, according to the available data) and Abstracts Views on Vision4Press platform.
Data correspond to usage on the plateform after 2015. The current usage metrics is available 48-96 hours after online publication and is updated daily on week days.
Initial download of the metrics may take a while.