Fig. 6.
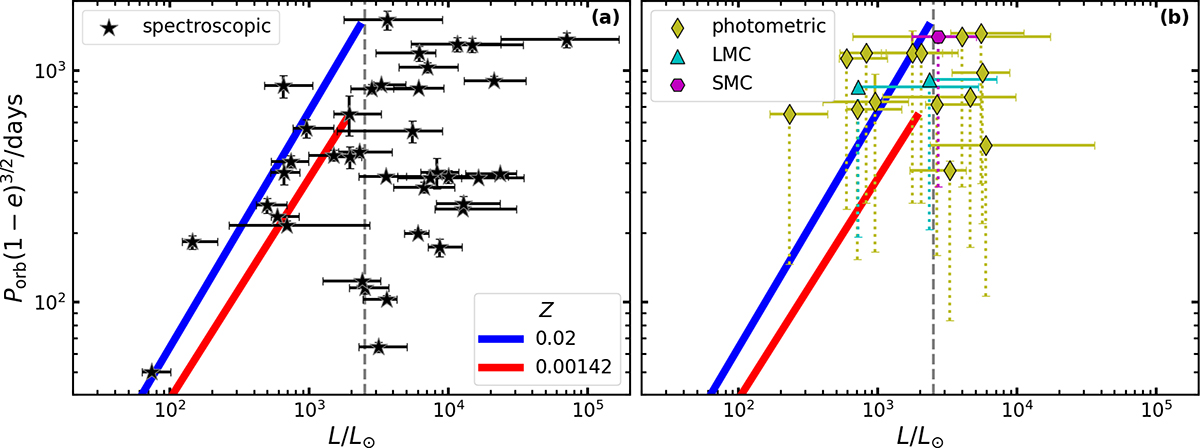
Download original image
Orbital period–luminosity diagram of the post-AGB and post-RGB binary sample. Panel (a) shows Galactic objects with spectroscopically determined orbits. Panel (b) shows objects with photometrically determined orbits from the samples of the Milky Way, the LMC, and the SMC. The orbital periods are multiplied by a factor of (1 − e)3/2, which allows for the comparison of our models to systems with eccentric orbits, since in eccentric orbits mass transfer would occur during periastron (see e.g. Joss et al. 1987; Rappaport et al. 1995). Solid error bars show observational uncertainties. The objects with photometrically determined orbital periods have unknown eccentricities, and their markers correspond to an assumed circular orbit. Dotted error bars represent the range in Porb(1 − e)3/2 assuming that their eccentricity falls between 0 − 0.63, as observed for the sample with spectroscopic orbits. The solid lines show the luminosity-orbital period relations given by Eq. (1). The dashed grey lines correspond to the RGB-tip luminosity of 2500 L⊙.
Current usage metrics show cumulative count of Article Views (full-text article views including HTML views, PDF and ePub downloads, according to the available data) and Abstracts Views on Vision4Press platform.
Data correspond to usage on the plateform after 2015. The current usage metrics is available 48-96 hours after online publication and is updated daily on week days.
Initial download of the metrics may take a while.