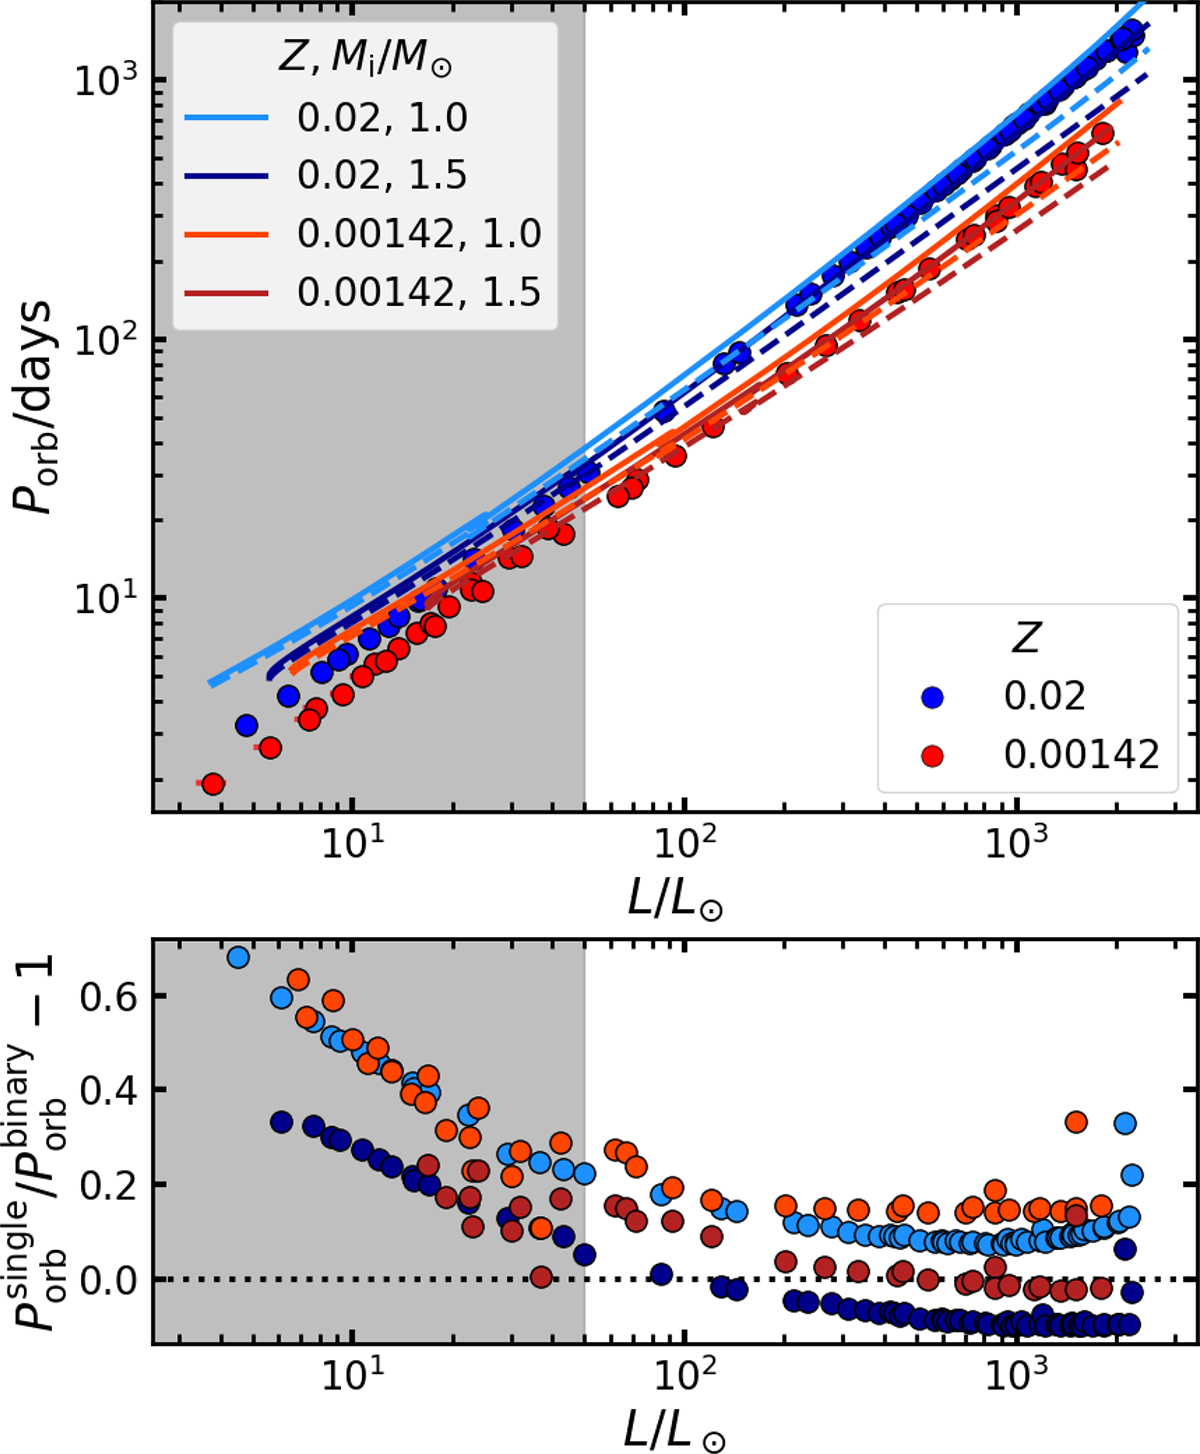
Fig. A.1.
Download original image
Orbital period-luminosity plot of our binary post-RGB models with initial primary masses below 2.0 M⊙, indicated by markers and colour-coded by metallicity. Also shown are the luminosity–orbital period relations derived from single-star donor models, colour-coded by metallicity and initial mass. Solid and dashed lines show those relations with and without atmospheric RLOF, respectively. The observed luminosity range of post-RGB stars is denoted by the non-darkened area (50 < L/L⊙ < 2500). The bottom panel shows the relative difference between the estimated orbital period from the single-star models, ![]() , and the orbital period from the binary models,
, and the orbital period from the binary models, ![]() , for the same luminosity, colour-coded by metallicity and initial mass of the single-star model.
, for the same luminosity, colour-coded by metallicity and initial mass of the single-star model.
Current usage metrics show cumulative count of Article Views (full-text article views including HTML views, PDF and ePub downloads, according to the available data) and Abstracts Views on Vision4Press platform.
Data correspond to usage on the plateform after 2015. The current usage metrics is available 48-96 hours after online publication and is updated daily on week days.
Initial download of the metrics may take a while.