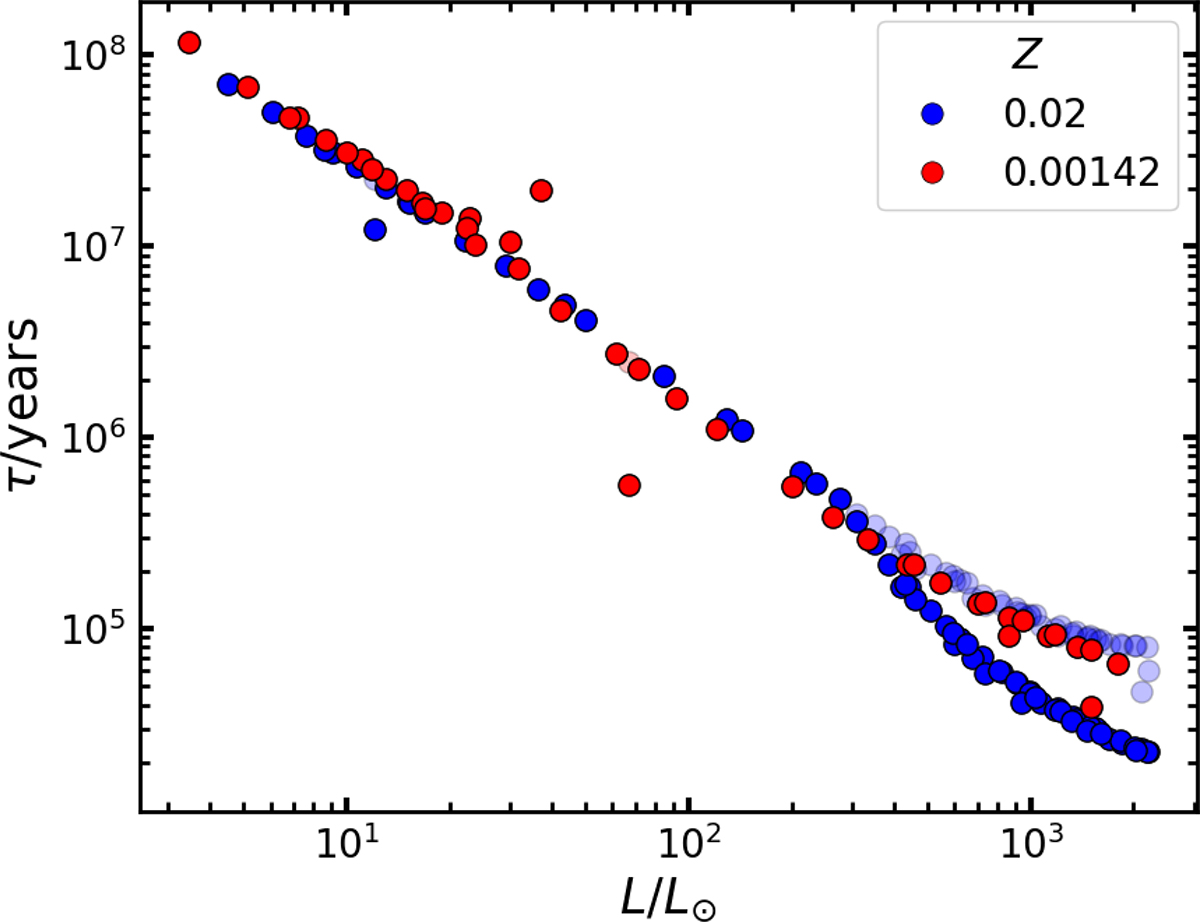
Fig. B.1.
Download original image
Evolutionary timescale-luminosity plot of our post-RGB models with initial primary masses below 2.0 M⊙, indicated by markers and colour-coded by metallicity. Opaque markers show the evolutionary timescale from an effective temperature of 4000 K to 8500 K, while translucent markers show the evolutionary timescale from the end of mass transfer to an effective temperature of 8500 K.
Current usage metrics show cumulative count of Article Views (full-text article views including HTML views, PDF and ePub downloads, according to the available data) and Abstracts Views on Vision4Press platform.
Data correspond to usage on the plateform after 2015. The current usage metrics is available 48-96 hours after online publication and is updated daily on week days.
Initial download of the metrics may take a while.