Fig. 1
Download original image
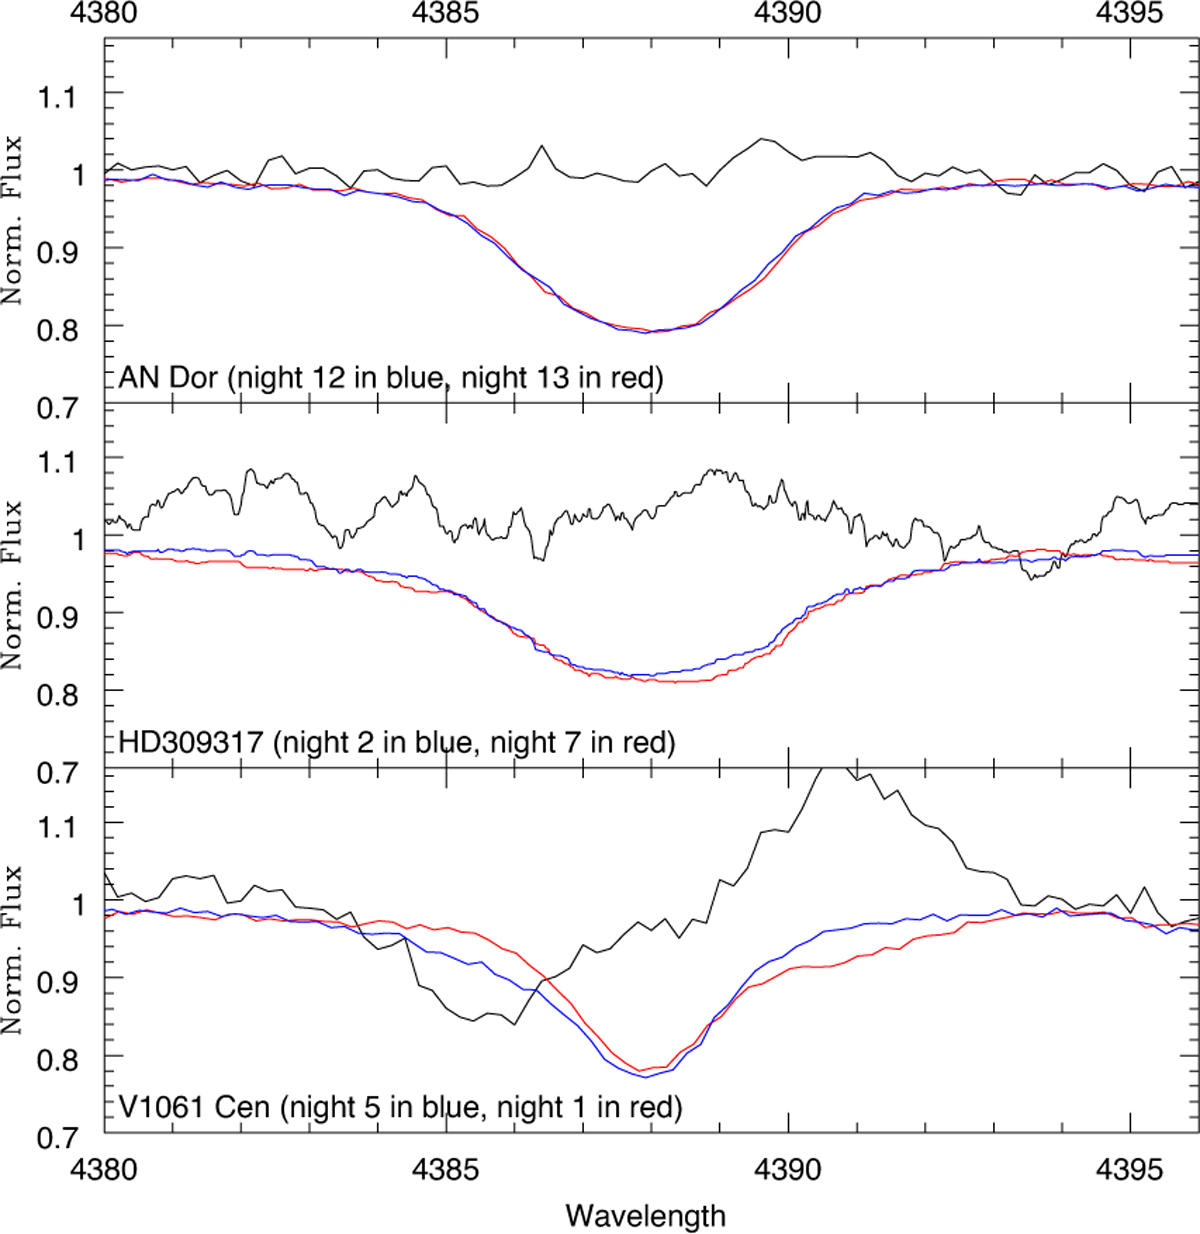
Line profiles of He I λ4388 Å in the most blue- and redshifted spectra (blue and red lines, respectively) for AN Dor, HD 309317, and V1061 Cen. The spectra were corrected for the measured RVs, and the black line provides their difference (multiplied by four and then shifted by +1 to facilitate the comparison with the lines).
Current usage metrics show cumulative count of Article Views (full-text article views including HTML views, PDF and ePub downloads, according to the available data) and Abstracts Views on Vision4Press platform.
Data correspond to usage on the plateform after 2015. The current usage metrics is available 48-96 hours after online publication and is updated daily on week days.
Initial download of the metrics may take a while.