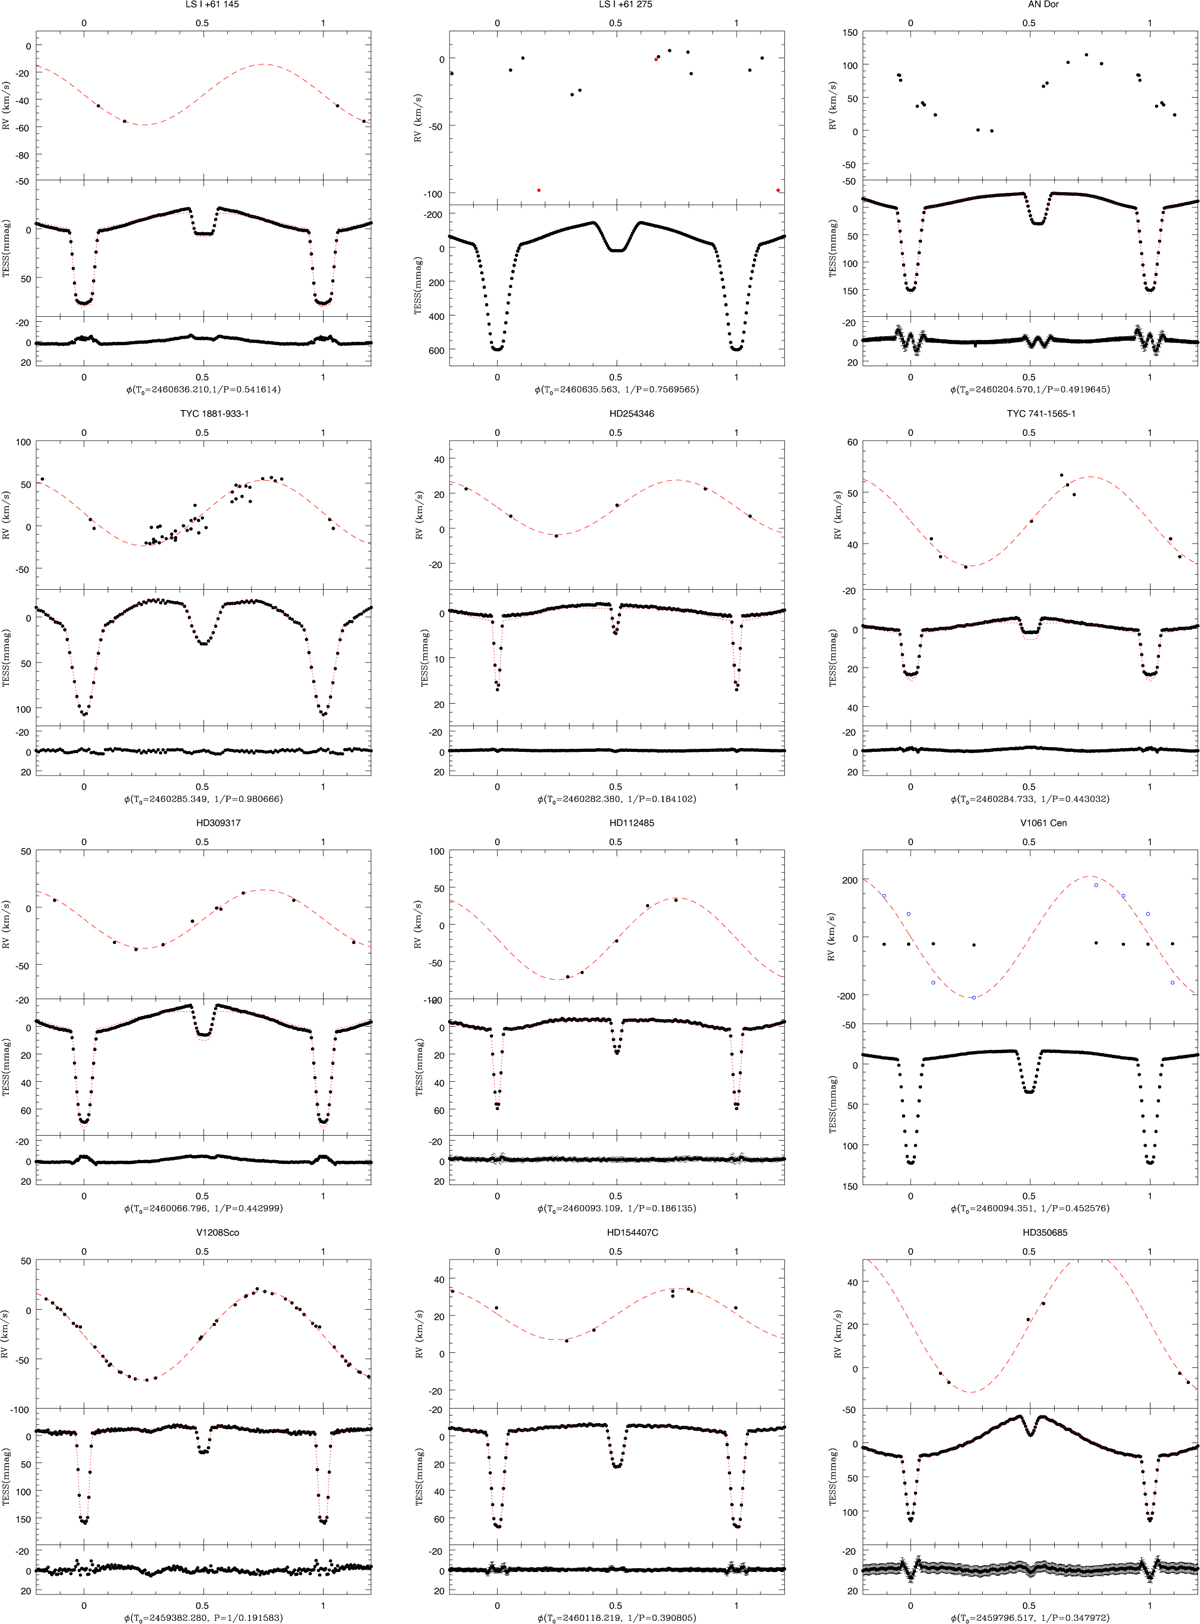
Fig. B.2
Download original image
Binned and averaged light curves of all targets (bottom panels - the data used to produce these curves are identified by boldface in Table A.1; residuals are shown if a fitting was achieved), together with RV curves (top panels). The folding was done using the ephemerides of Table A.2. The best-fit solutions from Table A.3 are superimposed to the data using red lines. For LS I +61 275, the black RV points come from APOGEE while the red ones come from Huang & Gies (2006a), showing the discrepancy between them. For V1061 Cen, the black filled dots and blue circles correspond to the main and fainter spectral components, respectively (see Table B.2 and text for details).
Current usage metrics show cumulative count of Article Views (full-text article views including HTML views, PDF and ePub downloads, according to the available data) and Abstracts Views on Vision4Press platform.
Data correspond to usage on the plateform after 2015. The current usage metrics is available 48-96 hours after online publication and is updated daily on week days.
Initial download of the metrics may take a while.