Fig. 3
Download original image
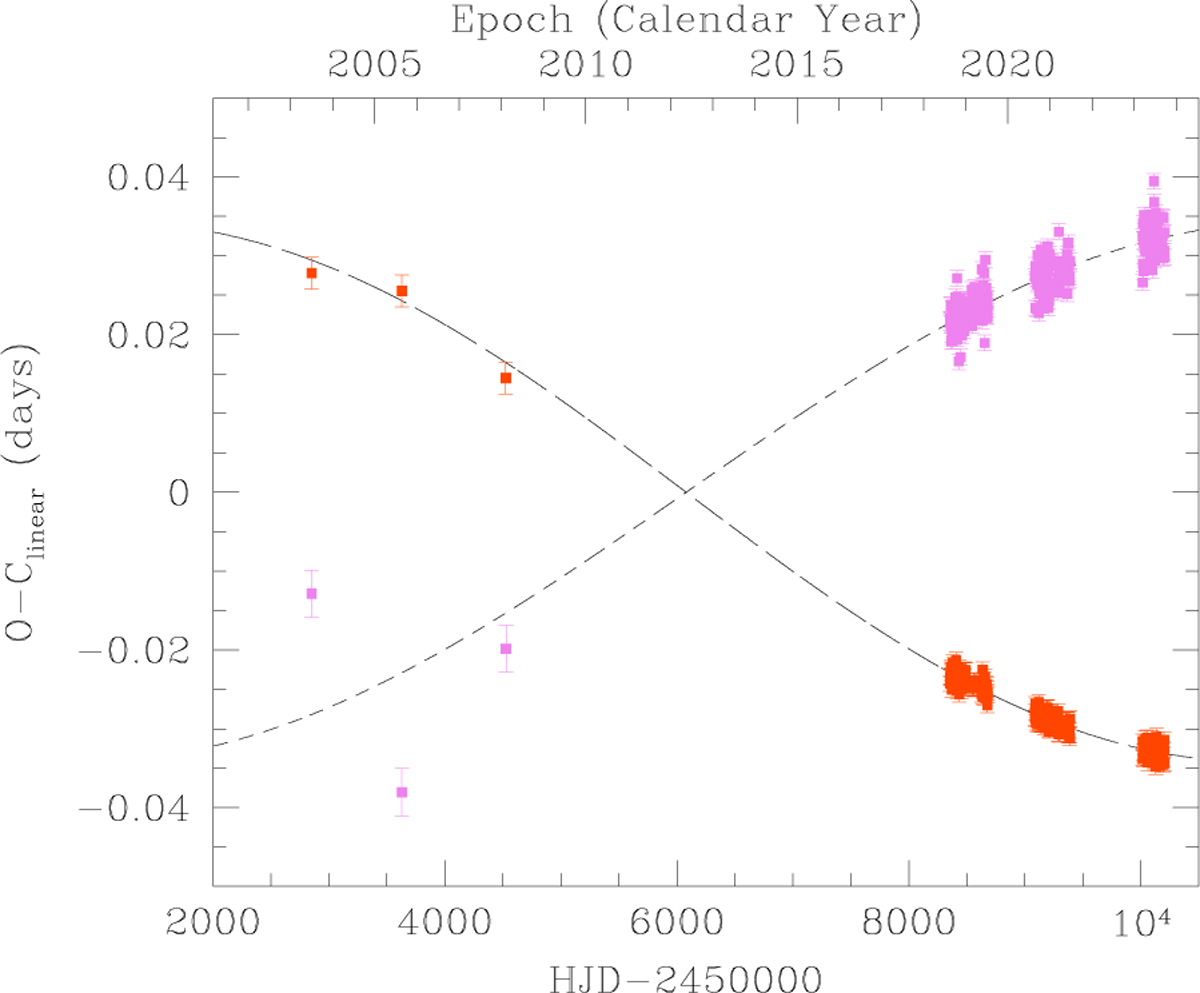
Best-fit adjustment to the differences between the observed times of minima of AN Dor and the linear ephemerides O − Clinear for i = 80°. The orange and pink symbols show the eclipses by the primary and secondary stars, respectively. Data prior to 2010 are taken from the ASAS survey, and data after 2018 are taken from TESS photometry. The long and short dashed lines yield our best-fit theoretical relations for the times of minima. In this plot, the linear ephemerides are T0 = 2 460 204.6031 and Psd = 2.0326782 d.
Current usage metrics show cumulative count of Article Views (full-text article views including HTML views, PDF and ePub downloads, according to the available data) and Abstracts Views on Vision4Press platform.
Data correspond to usage on the plateform after 2015. The current usage metrics is available 48-96 hours after online publication and is updated daily on week days.
Initial download of the metrics may take a while.