Fig. 5
Download original image
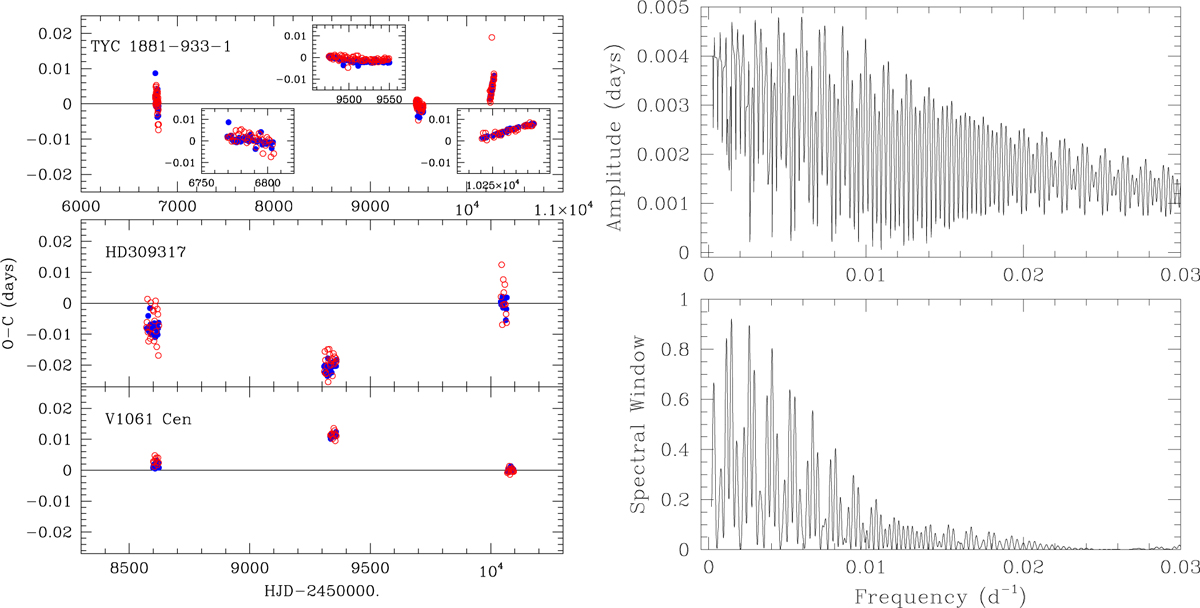
Left : differences between observed and predicted eclipse times based on the ephemerides of Table A.2. The data for the deeper eclipse are shown by blue dots, and the data for the shallower eclipse are shown as red circles. Close-ups are provided for TYC 1881-933-1. Right : Fourier spectrum of the O − C values of the times of primary minimum of TYC 1881-933-1 (top panel) and the associated spectral window (bottom panel).
Current usage metrics show cumulative count of Article Views (full-text article views including HTML views, PDF and ePub downloads, according to the available data) and Abstracts Views on Vision4Press platform.
Data correspond to usage on the plateform after 2015. The current usage metrics is available 48-96 hours after online publication and is updated daily on week days.
Initial download of the metrics may take a while.