Fig. 7
Download original image
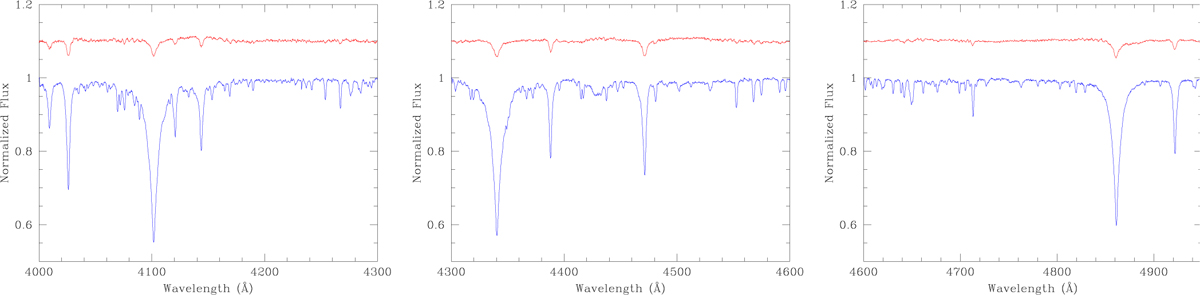
Result of the disentangling for V1061 Cen. The main component is shown in blue, and the fainter component is shown in red (continuum shifted by +0.2 for clarity). No adjustment for the light ratio was made. The line depths are those observed in the input spectra, i.e., with respect to the combined light of all stars in the system.
Current usage metrics show cumulative count of Article Views (full-text article views including HTML views, PDF and ePub downloads, according to the available data) and Abstracts Views on Vision4Press platform.
Data correspond to usage on the plateform after 2015. The current usage metrics is available 48-96 hours after online publication and is updated daily on week days.
Initial download of the metrics may take a while.