Fig. 3
Download original image
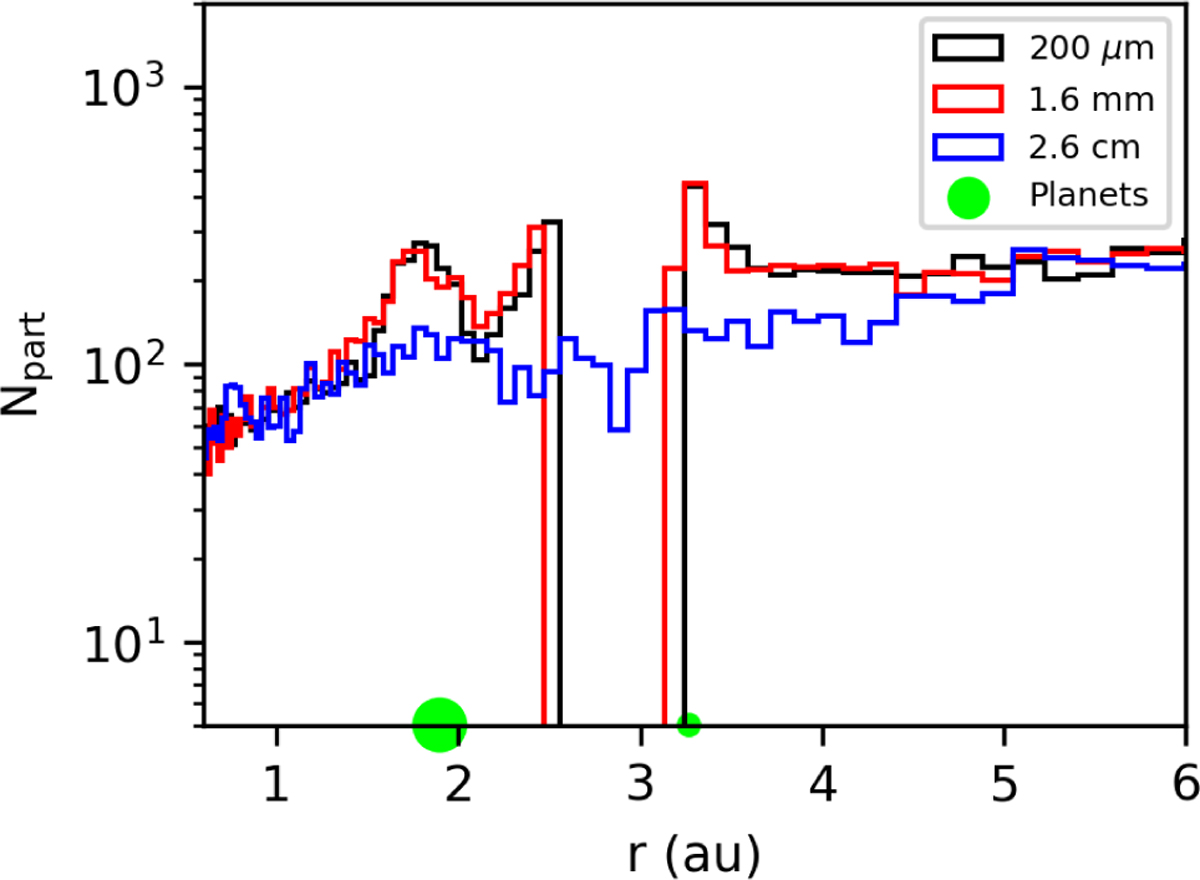
Histogram illustrating the number density of dust particles in Model 1 as a function of radial distance from the star. The number density is computed in 100 radial bins with logarithmic spacing. Filled green circles mark the positions of the planets. The black line represents 200-micron particles, while the red and blue lines represent 1.6−mm and 2.6−cm grains, respectively.
Current usage metrics show cumulative count of Article Views (full-text article views including HTML views, PDF and ePub downloads, according to the available data) and Abstracts Views on Vision4Press platform.
Data correspond to usage on the plateform after 2015. The current usage metrics is available 48-96 hours after online publication and is updated daily on week days.
Initial download of the metrics may take a while.