Fig. 4
Download original image
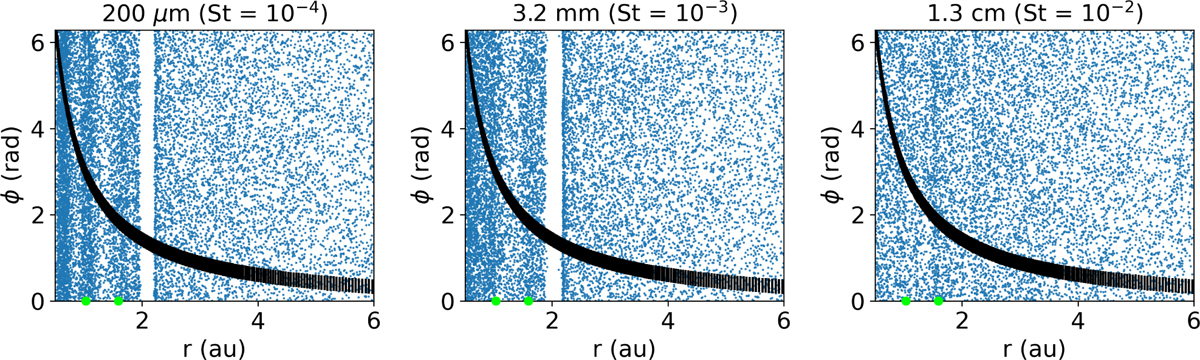
Dust distribution in Model 2. From left to right, the dust particle distributions in the (r, φ) plane for 200 μm, 3.2 mm, and 1.3 cm dust sizes in Model 2, respectively. The black lines show radial density distribution of the gas normalized between (0, 2 π), while the filled green circles mark the position of the planets. The plots are zoomed in the inner region (0.5, 5) au and the width of the density profile is multiplied by a constant for readability.
Current usage metrics show cumulative count of Article Views (full-text article views including HTML views, PDF and ePub downloads, according to the available data) and Abstracts Views on Vision4Press platform.
Data correspond to usage on the plateform after 2015. The current usage metrics is available 48-96 hours after online publication and is updated daily on week days.
Initial download of the metrics may take a while.