Open Access
Fig. 4
Download original image
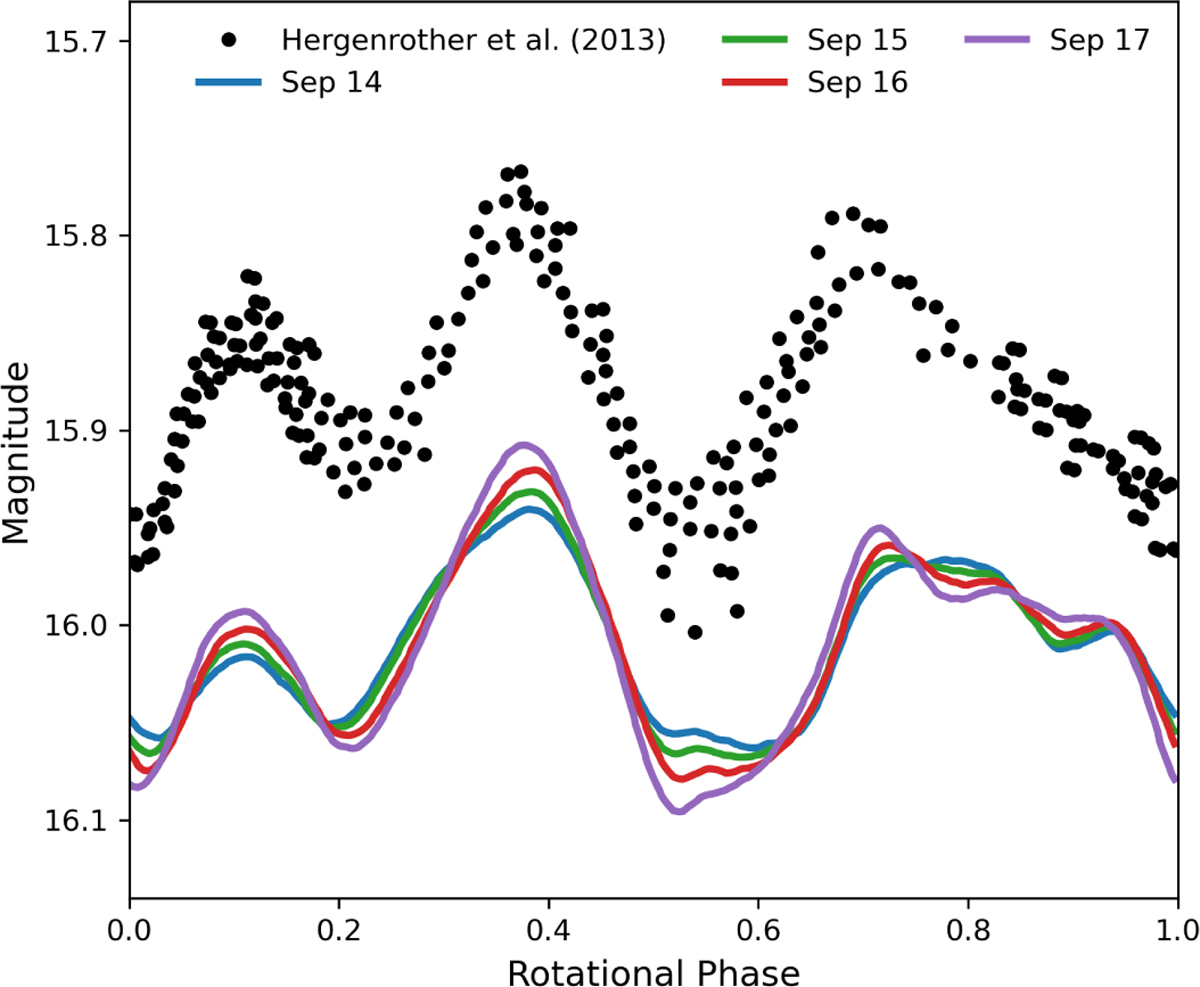
Observational data from the light curve published by Hergenrother et al. (2013) shown with black dots. Colored lines show the synthetic rotational light curves of Bennu as seen from Earth on 14-17 September 2005, sampled at one point per degree of rotation. An offset is applied to the synthetic light curves for clarity.
Current usage metrics show cumulative count of Article Views (full-text article views including HTML views, PDF and ePub downloads, according to the available data) and Abstracts Views on Vision4Press platform.
Data correspond to usage on the plateform after 2015. The current usage metrics is available 48-96 hours after online publication and is updated daily on week days.
Initial download of the metrics may take a while.