Open Access
Fig. 6
Download original image
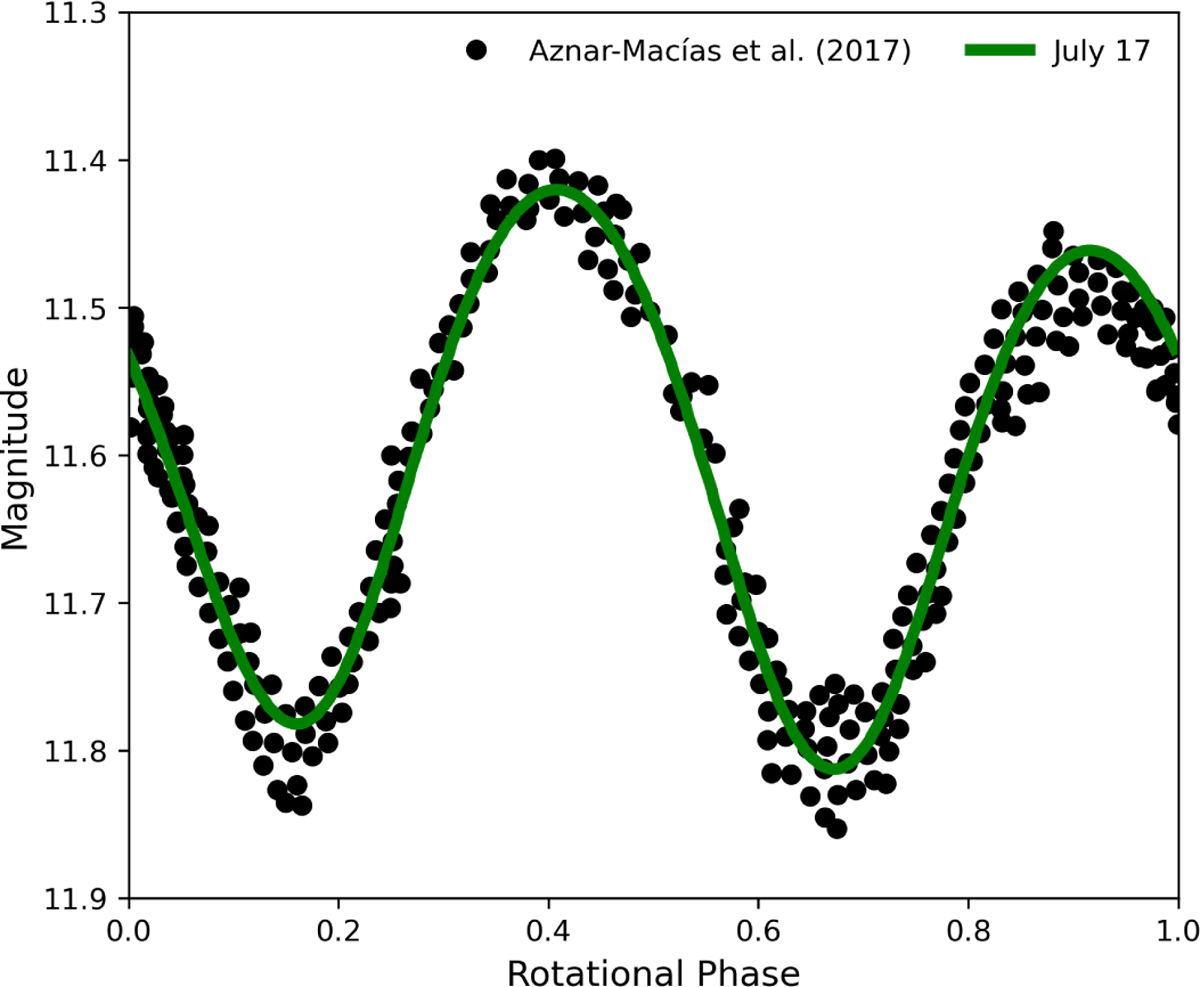
Observational data from the light curve published by Aznar Macias et al. (2018) represented by black dots. The green line shows the synthetic rotational light curve of Eros as seen from Earth on July 17, 2016, sampled at one point per degree of rotation.
Current usage metrics show cumulative count of Article Views (full-text article views including HTML views, PDF and ePub downloads, according to the available data) and Abstracts Views on Vision4Press platform.
Data correspond to usage on the plateform after 2015. The current usage metrics is available 48-96 hours after online publication and is updated daily on week days.
Initial download of the metrics may take a while.