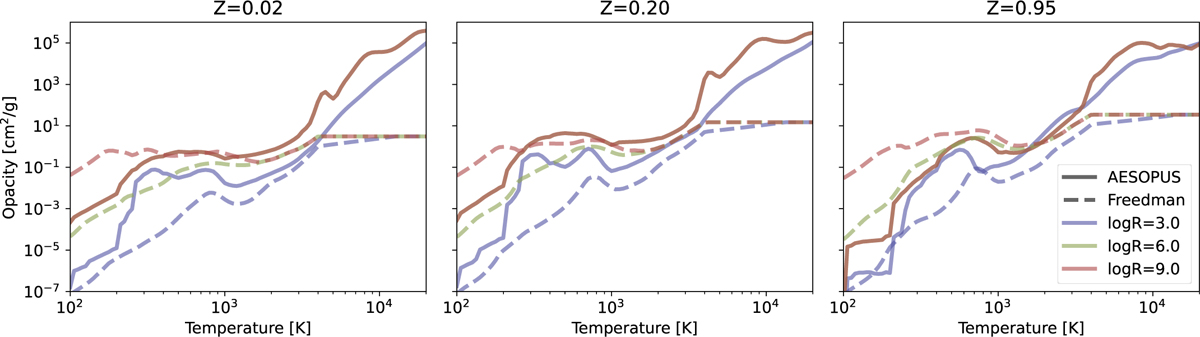
Fig. A.1
Download original image
Radiative opacity as a function of temperature for constant log R. The left, middle and right panels correspond to metallicities of Ζ = 0.02, 0.20, and 0.95, respectively. The dashed line shows the radiative opacity from Freedman et al. (2014) as included in MESA and the solid line shows the custom-made AESOPUS2.1 tables using the web interface (Marigo et al. 2024). The three different colors show different values for log R. We note that the AESOPUS2.1 tables are only available up to log R = 6, resulting in the same AESOPUS2.1 opacities for log R ≥ 6 for a given temperature (orange and green solid-line).
Current usage metrics show cumulative count of Article Views (full-text article views including HTML views, PDF and ePub downloads, according to the available data) and Abstracts Views on Vision4Press platform.
Data correspond to usage on the plateform after 2015. The current usage metrics is available 48-96 hours after online publication and is updated daily on week days.
Initial download of the metrics may take a while.