Fig. C.1
Download original image
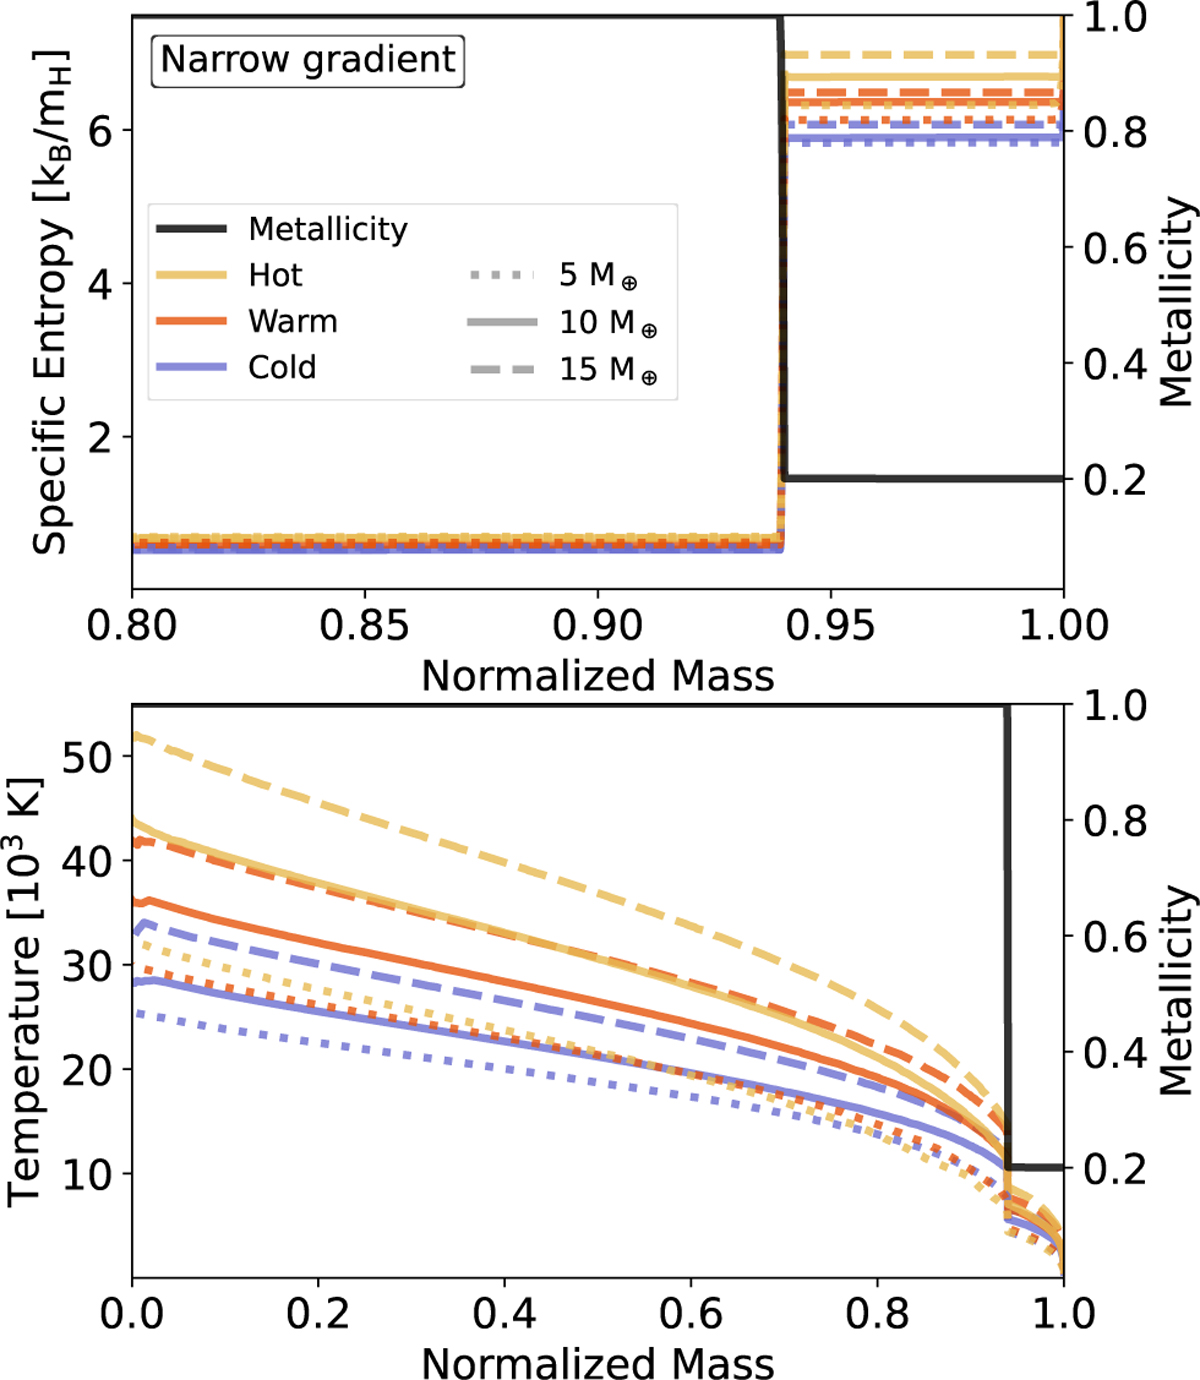
Initial profiles for the narrow composition gradient, showing specific entropy, temperature, and composition as functions of normalized mass. The colors blue, orange, and yellow correspond to different primordial entropies. The dotted, solid, and dashed lines correspond to planets with a mass of 5 Μ⊕, 10 Μ⊕, and 15 Μ⊕, respectively. Top: Specific entropy vs. normalized mass of the initial model for the narrow composition profile. The blue (cold), orange (warm), and yellow (hot) colors represent different initial entropies. The dotted, solid, and dashed lines correspond to planets with a mass of 5 Μ⊕, 10 Μ⊕, and 15 M⊕, respectively. The metallicity of the composition profile is represented by a black line, with its y-axis on the right-hand side. Bottom: Temperature vs. normalized mass of the initial model for the narrow composition profile. The black line shows the metallicity.
Current usage metrics show cumulative count of Article Views (full-text article views including HTML views, PDF and ePub downloads, according to the available data) and Abstracts Views on Vision4Press platform.
Data correspond to usage on the plateform after 2015. The current usage metrics is available 48-96 hours after online publication and is updated daily on week days.
Initial download of the metrics may take a while.