Fig. 3
Download original image
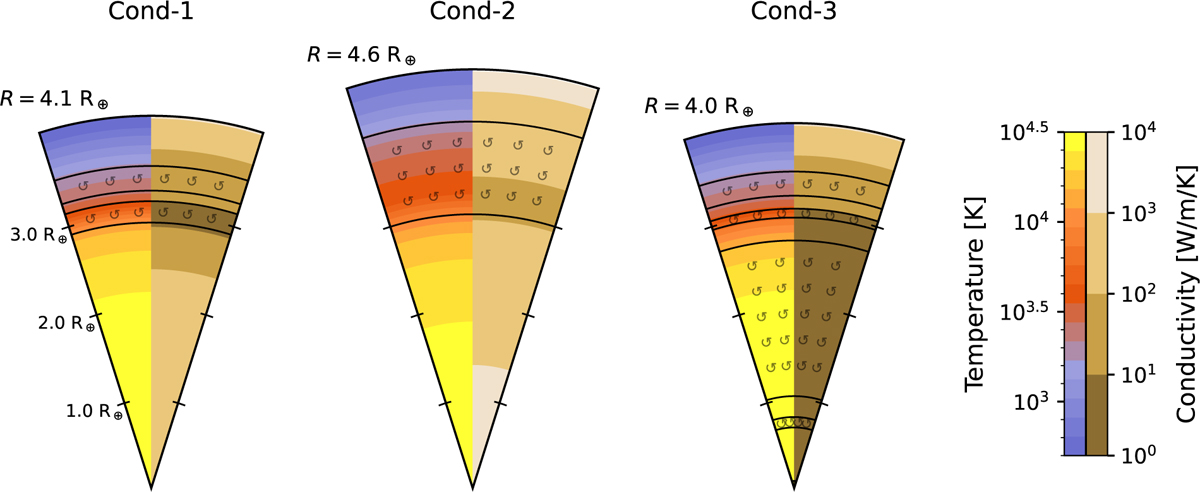
Temperature and conductivity as a function of the radius at t = 5 Gyr for our three cases of the “warm” planet with Mp = 10 Μ⊕. In each panel, the temperature is shown in the left half of the cone, colored in blue, red, and yellow from cold to hot. The order of magnitude of the conductivity is shown in the right half of each cone, colored in different shades of brown. The areas with circular arrows indicate convective regions within the planet. The 1 bar radius is also indicated.
Current usage metrics show cumulative count of Article Views (full-text article views including HTML views, PDF and ePub downloads, according to the available data) and Abstracts Views on Vision4Press platform.
Data correspond to usage on the plateform after 2015. The current usage metrics is available 48-96 hours after online publication and is updated daily on week days.
Initial download of the metrics may take a while.