Fig. 8
Download original image
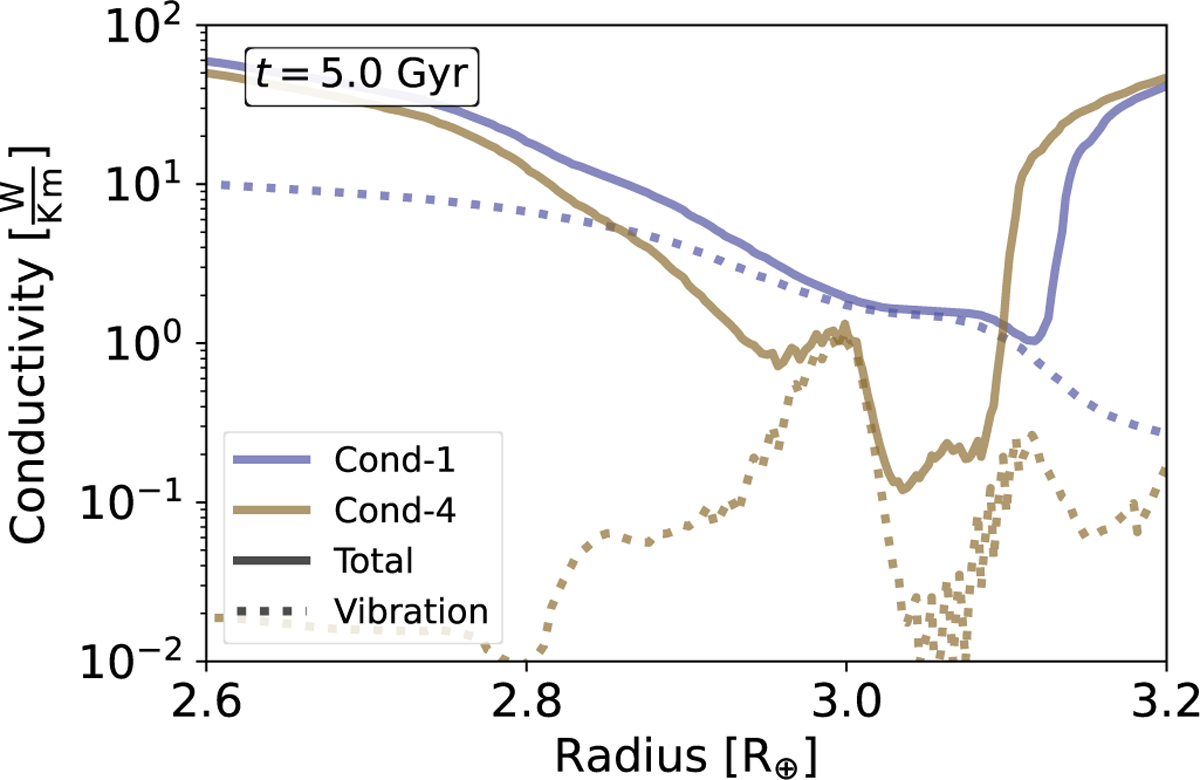
Conductivity vs. radius at t = 5 Gyr for the warm Mp = 10 M⊕ planet. The blue and brown lines correspond to Cond-1 and Cond-4. respectively. The total conductivity is shown by the solid line, and the thick line shows the contribution from the vibrational conductivity. Outside the shown radius window, the conductivity is dominated by the electron and radiation contribution.
Current usage metrics show cumulative count of Article Views (full-text article views including HTML views, PDF and ePub downloads, according to the available data) and Abstracts Views on Vision4Press platform.
Data correspond to usage on the plateform after 2015. The current usage metrics is available 48-96 hours after online publication and is updated daily on week days.
Initial download of the metrics may take a while.