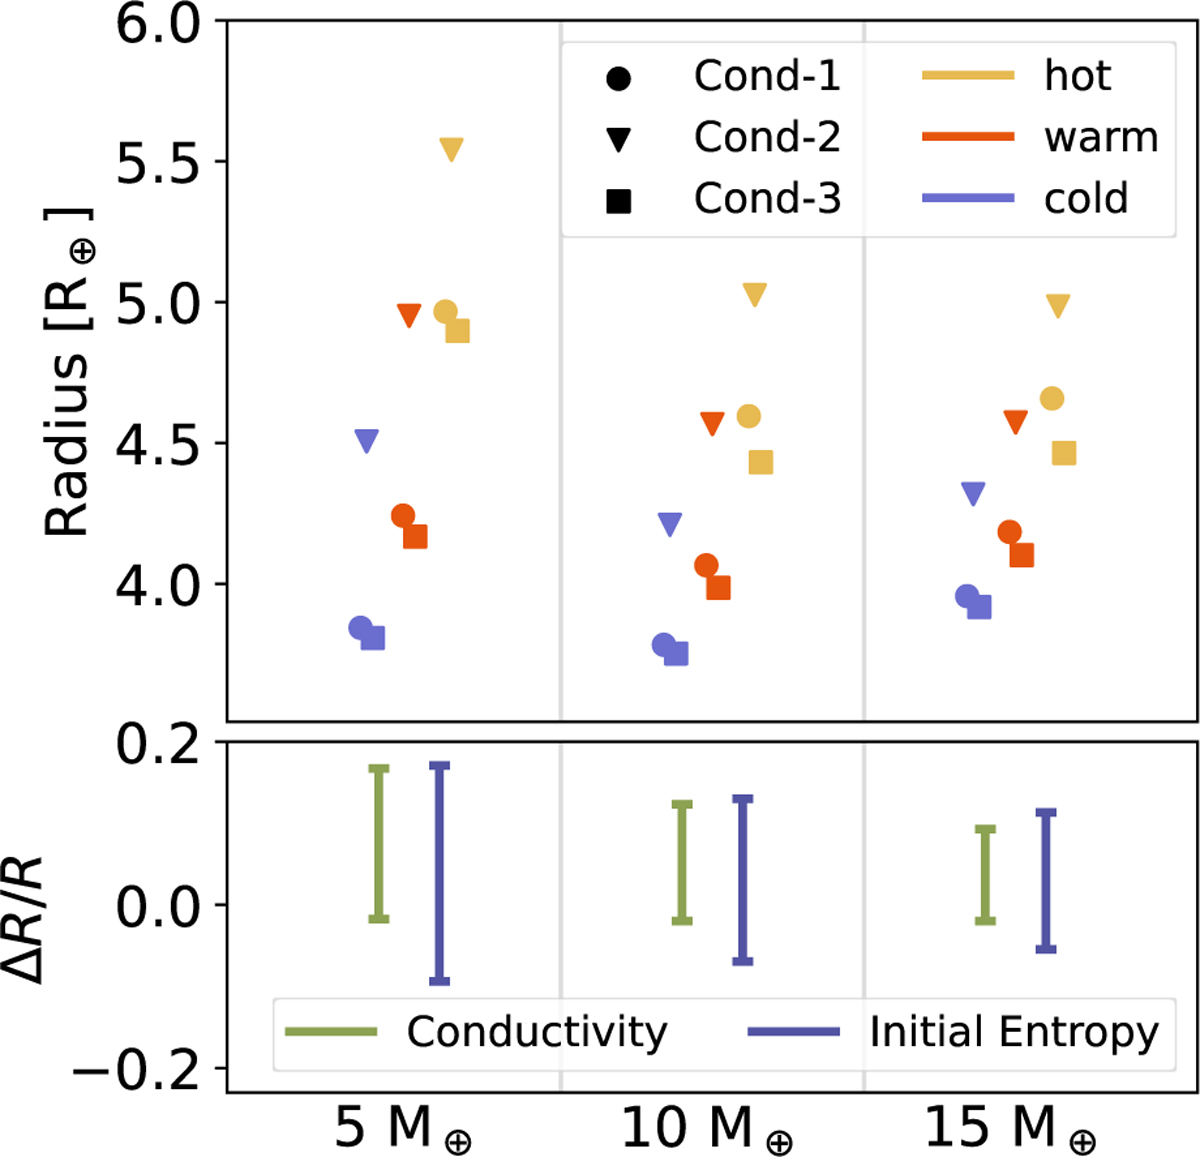
Fig. 9
Download original image
Planetary radius at t = 5 Gyr and relative difference between the models and initial entropies. Top: planetary radius at t = 5 Gyr for the models with the wide composition gradient. Different markers indicate the different conductivity cases, while the different colors correspond to the different initial entropies. The three planet masses (Mp = 5, 10, and 15 Μ⊕) are shown from left to right. Bottom: relative difference of the inferred radius ΔR/R = (R′ – R)/R. Green corresponds to the deviation caused by the different assumed conductivities. We compare the warm Cond-1 with the warm Cond-2 and Cond-3. Blue corresponds to the deviation caused by different initial entropy states. We compare the warm Cond-1 with the cold and hot Cond-1.
Current usage metrics show cumulative count of Article Views (full-text article views including HTML views, PDF and ePub downloads, according to the available data) and Abstracts Views on Vision4Press platform.
Data correspond to usage on the plateform after 2015. The current usage metrics is available 48-96 hours after online publication and is updated daily on week days.
Initial download of the metrics may take a while.