Fig. 6
Download original image
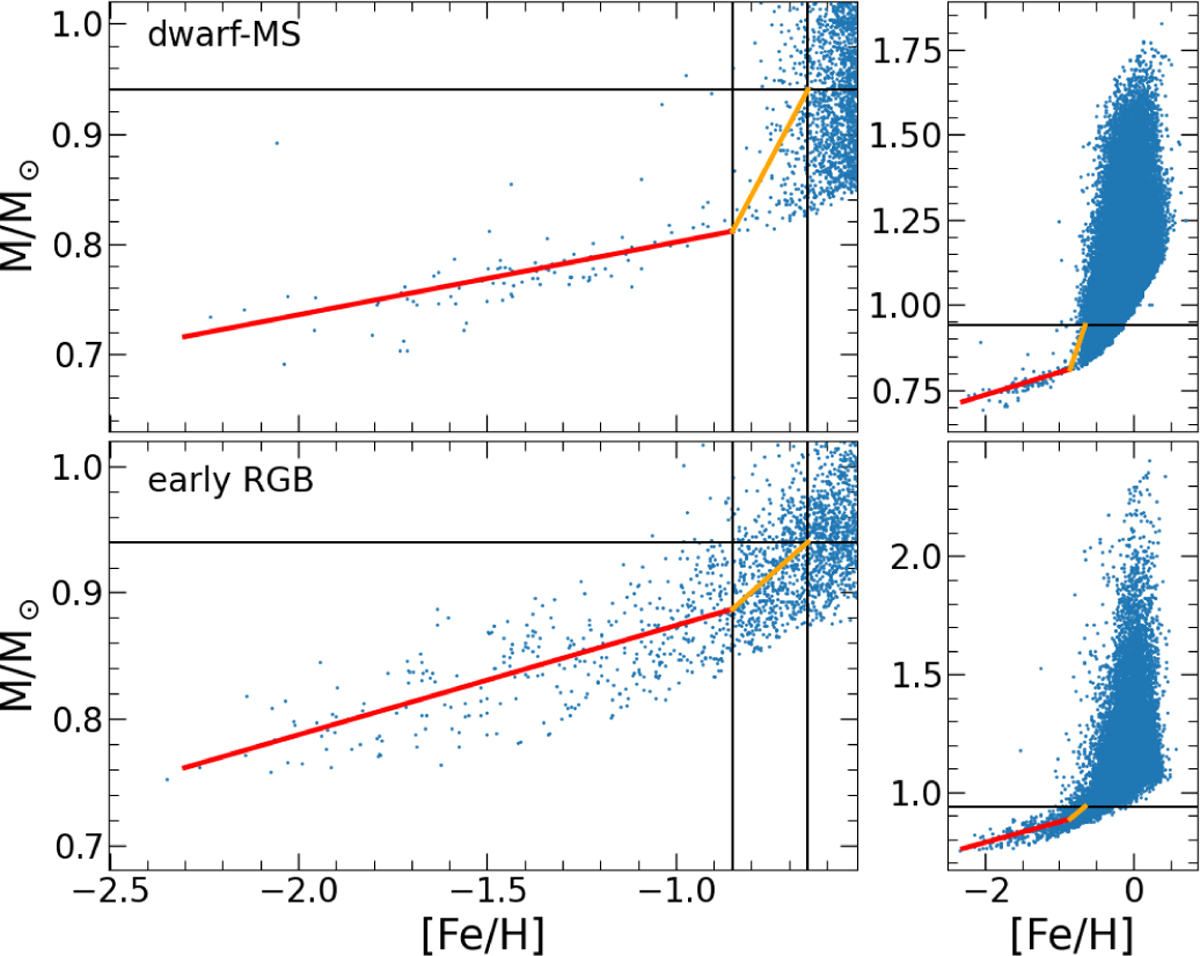
Mass distribution with metallicity in two samples of dwarf MS stars (top panel) and early RGB stars (bottom panel) selected from the GALAH catalogue. The left panels zoom in on the low-mass and metal-poor area. The right panels show the whole sample. The empirical relations at two regions of [Fe/H] are shown as red and orange solid lines. The black horizontal line indicates the mass limit 0.94M⊙, while the vertical lines indicate the metallicity [Fe/H] = -0.85 and -0.65.
Current usage metrics show cumulative count of Article Views (full-text article views including HTML views, PDF and ePub downloads, according to the available data) and Abstracts Views on Vision4Press platform.
Data correspond to usage on the plateform after 2015. The current usage metrics is available 48-96 hours after online publication and is updated daily on week days.
Initial download of the metrics may take a while.