Fig. 1.
Download original image
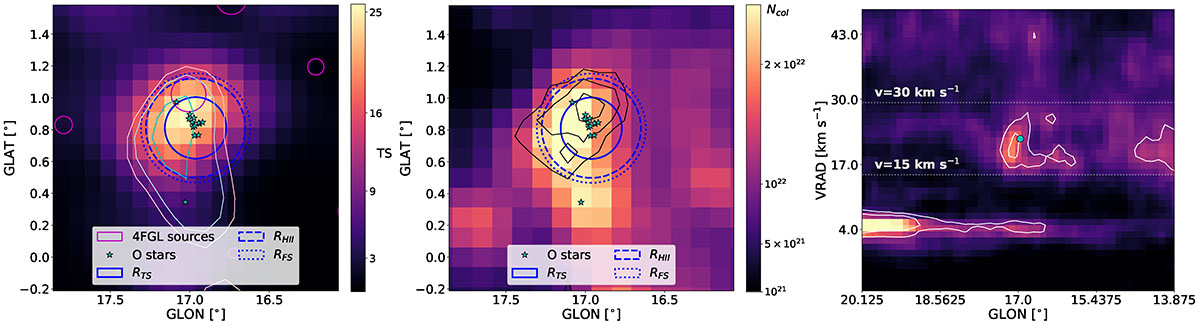
Left: Test statistics map in the region around M16 derived from Fermi-LAT observations. The position of the O stars in the cluster NGC 6611 is indicated as blue stars, and its termination and forward shock radii are indicated a solid and dotted blue circles. The dashed circle indicates the limit of the H II region. The light blue, cyan, and pink contours indicate CO gas column densities of 1.5 × 10²², 1.7 × 10²², and 2.3 × 1022 cm−2, which were obtained in the velocity range 15–30 km s−1. The magenta circles indicate the position of Fermi sources from the 4FGL catalog Ballet (2023) and their relative position uncertainties, evaluated as their 68% confidence radius. Center: Molecular gas distribution in the region as traced by CO line emission, integrated over the line of sight in the velocity range 15 km/s, 30 km/s. The black contours refer to Fermi-LAT test statistics and represent 3, 4, and 5σ levels. Right: Velocity-longitude distribution of CO. The map is integrated over the whole latitude range. The dot indicates the position of NGC 6611.
Current usage metrics show cumulative count of Article Views (full-text article views including HTML views, PDF and ePub downloads, according to the available data) and Abstracts Views on Vision4Press platform.
Data correspond to usage on the plateform after 2015. The current usage metrics is available 48-96 hours after online publication and is updated daily on week days.
Initial download of the metrics may take a while.