Fig. 2.
Download original image
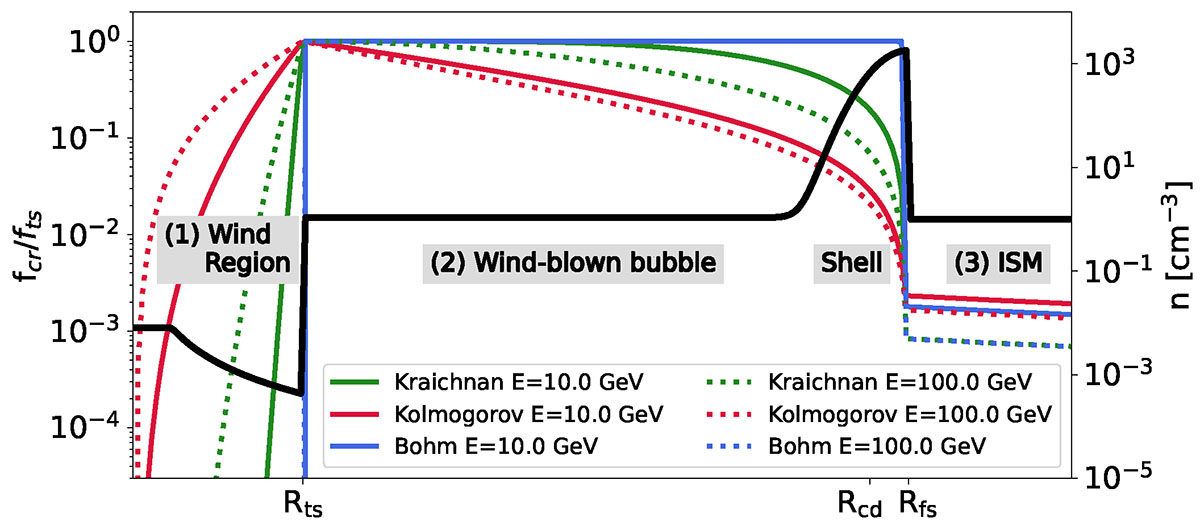
Distribution of the gas density as a function of the radial distance from the center of the cluster (black curve) and the radial distribution of accelerated particles at different energies (solid, 10 GeV; dotted, 100 GeV), considering propagation in Bohm (blue), Kraichnan (green), or Kolmogorov (red) turbulence. The highest value for the wind luminosity, Lw, 2, was assumed in the calculations.
Current usage metrics show cumulative count of Article Views (full-text article views including HTML views, PDF and ePub downloads, according to the available data) and Abstracts Views on Vision4Press platform.
Data correspond to usage on the plateform after 2015. The current usage metrics is available 48-96 hours after online publication and is updated daily on week days.
Initial download of the metrics may take a while.