Fig. 3.
Download original image
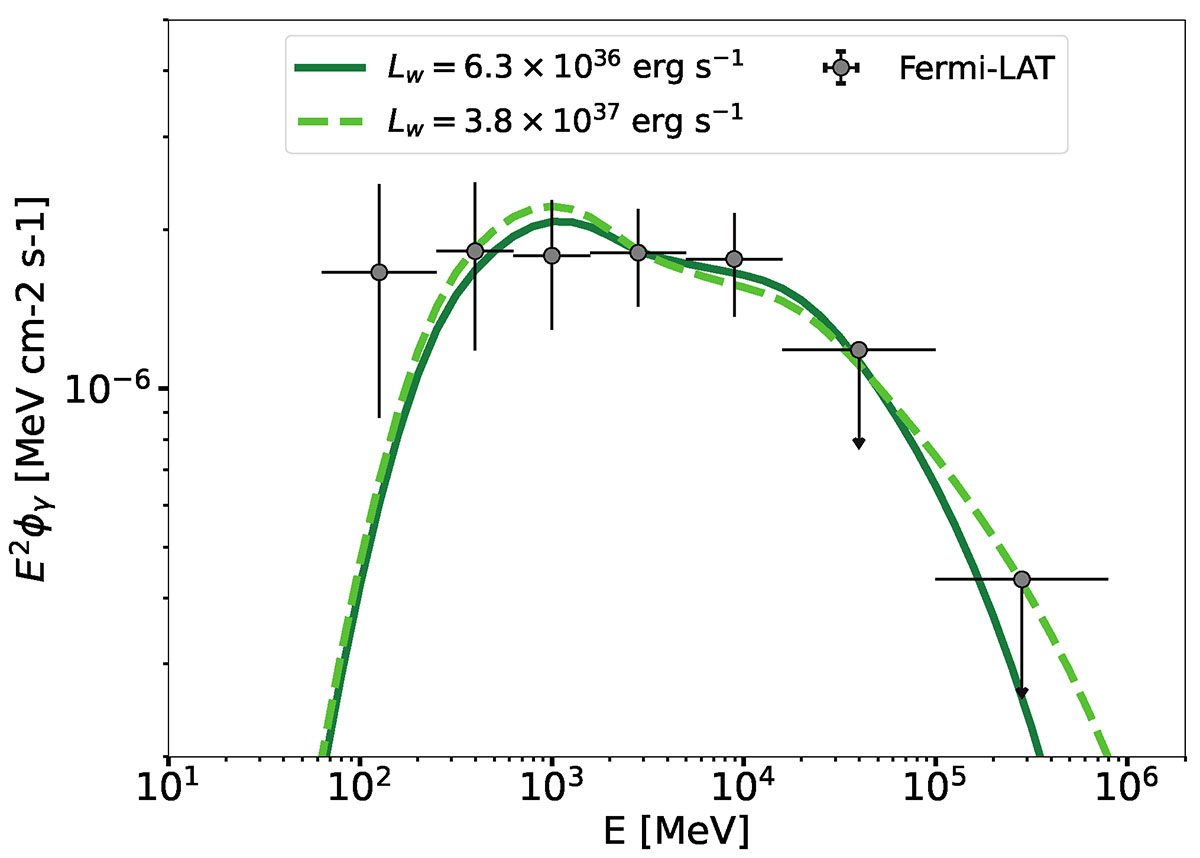
Spectral energy distribution (SED) of the source detected by Fermi-LAT in correspondence of NGC 6611/M16. The error bars refer to the statistical 1σ uncertainties. The solid and dashed green lines represent the emission model in the case of Kraichnan turbulence, and the lines differ in the assumed wind luminosity, Lw, as indicated in the figure legend.
Current usage metrics show cumulative count of Article Views (full-text article views including HTML views, PDF and ePub downloads, according to the available data) and Abstracts Views on Vision4Press platform.
Data correspond to usage on the plateform after 2015. The current usage metrics is available 48-96 hours after online publication and is updated daily on week days.
Initial download of the metrics may take a while.