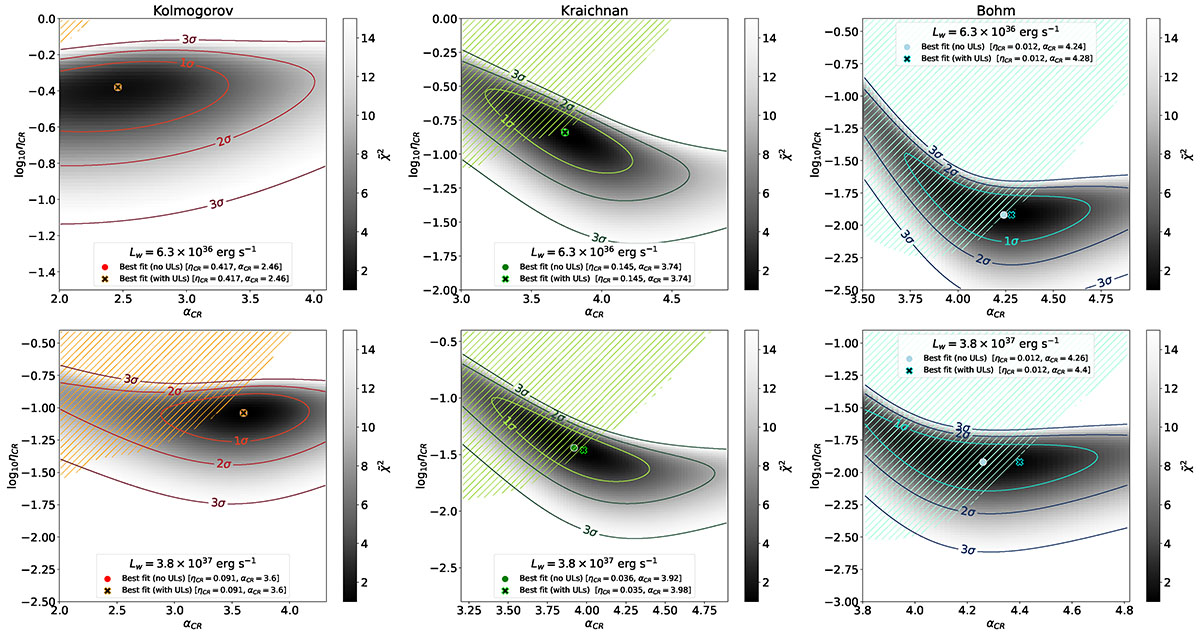
Fig. D.1.
Download original image
Parameter space explored with the fitting procedure. The darker zones are values with a smaller χ2, while the shaded regions represent those parameters excluded by the gamma-ray upper limits. The best fit value is indicated as circle, unless it is found in the forbidden parameter region, in which case the new best fit value is indicated as a cross.
Current usage metrics show cumulative count of Article Views (full-text article views including HTML views, PDF and ePub downloads, according to the available data) and Abstracts Views on Vision4Press platform.
Data correspond to usage on the plateform after 2015. The current usage metrics is available 48-96 hours after online publication and is updated daily on week days.
Initial download of the metrics may take a while.