Fig. 3.
Download original image
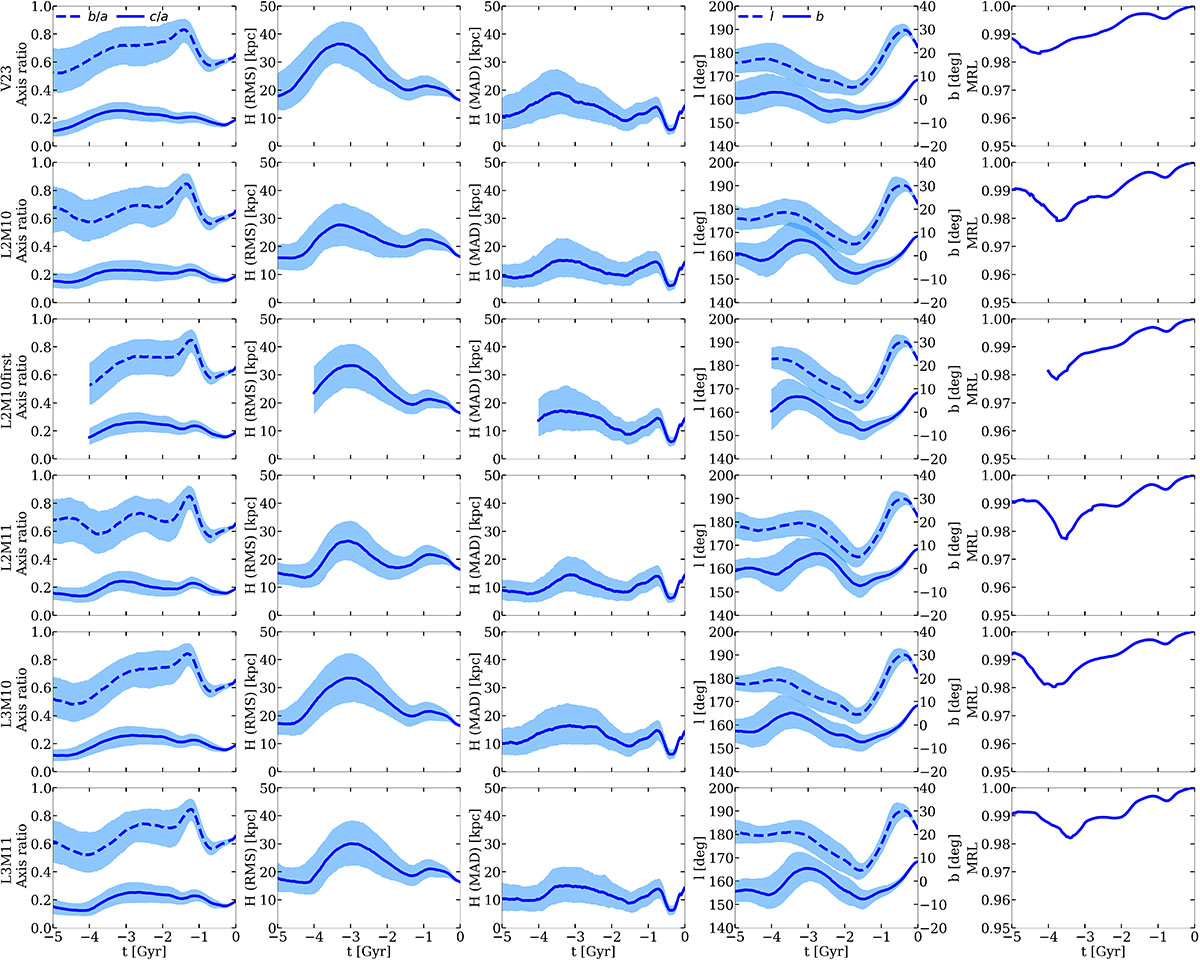
Time evolution of the structural parameters of the VPOS measured from the sample of on-plane MW satellites alone. Each row of panels represents the parameters for a different gravitational potential. Columns of plots represent from left to right: (1) the short-to-long axis ratio, c/a (solid line), and intermediate-to-long axis ratio, b/a (dashed line), (2) the thickness of the VPOS measured with the RMS, (3) the thickness of the VPOS measured with the MAD, (4) the Galactic longitude (l, dashed line) and latitude (b, solid line) of the direction of the normal vector of the VPOS, and (5) the MRL of the normal vector, all of them as a function of time. Lines represent the median values of the different metrics, and shaded areas the 16th and 84th quantiles.
Current usage metrics show cumulative count of Article Views (full-text article views including HTML views, PDF and ePub downloads, according to the available data) and Abstracts Views on Vision4Press platform.
Data correspond to usage on the plateform after 2015. The current usage metrics is available 48-96 hours after online publication and is updated daily on week days.
Initial download of the metrics may take a while.