Fig. 4.
Download original image
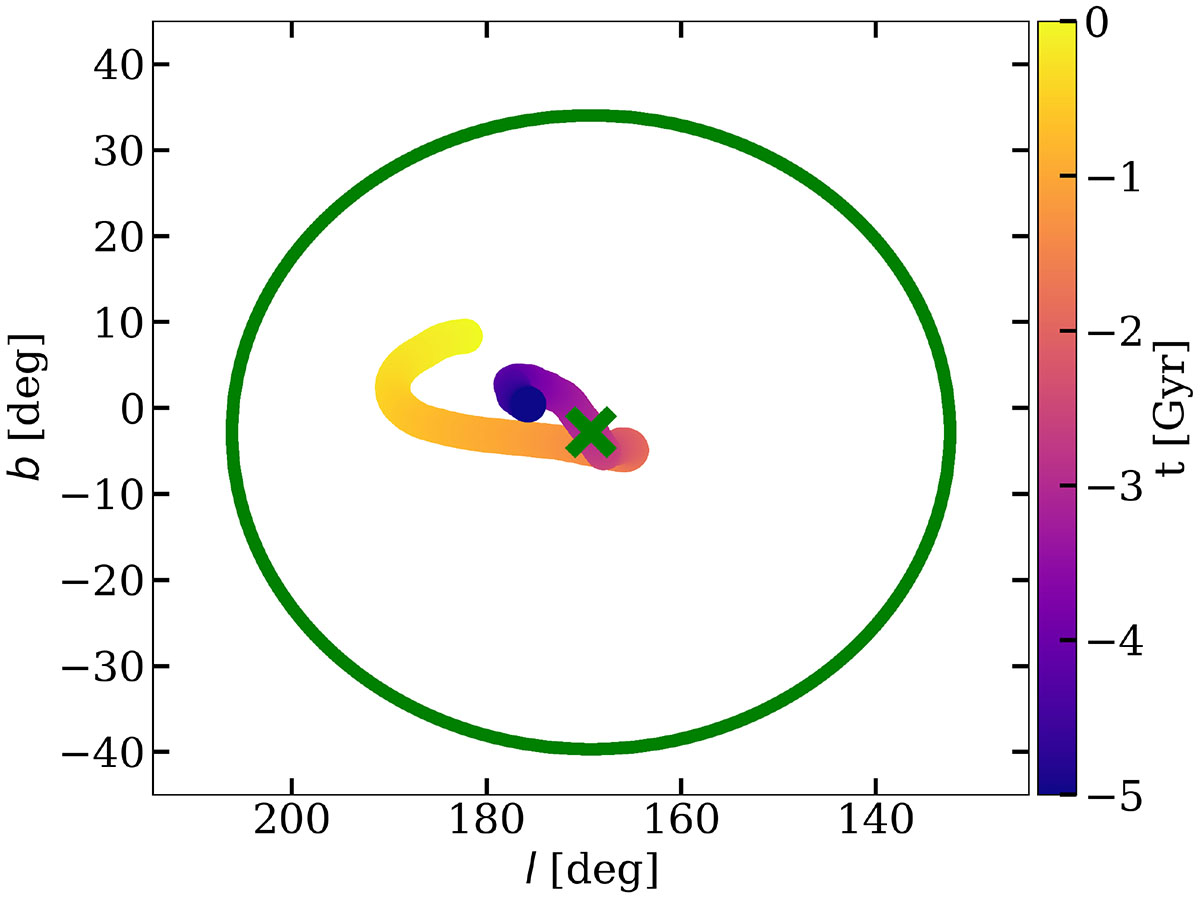
Evolution of the orientation of the VPOS. The colour-coded curve represents the time evolution of the direction of the normal vector of the VPOS in Galactic coordinates, measured from the on-plane MW satellites under the potential V23 (see Section 3.2.1). Green cross represents the VPOS normal direction reported in Pawlowski & Kroupa (2013) and green circle the border of the area around it encompassing 10% of the sky.
Current usage metrics show cumulative count of Article Views (full-text article views including HTML views, PDF and ePub downloads, according to the available data) and Abstracts Views on Vision4Press platform.
Data correspond to usage on the plateform after 2015. The current usage metrics is available 48-96 hours after online publication and is updated daily on week days.
Initial download of the metrics may take a while.