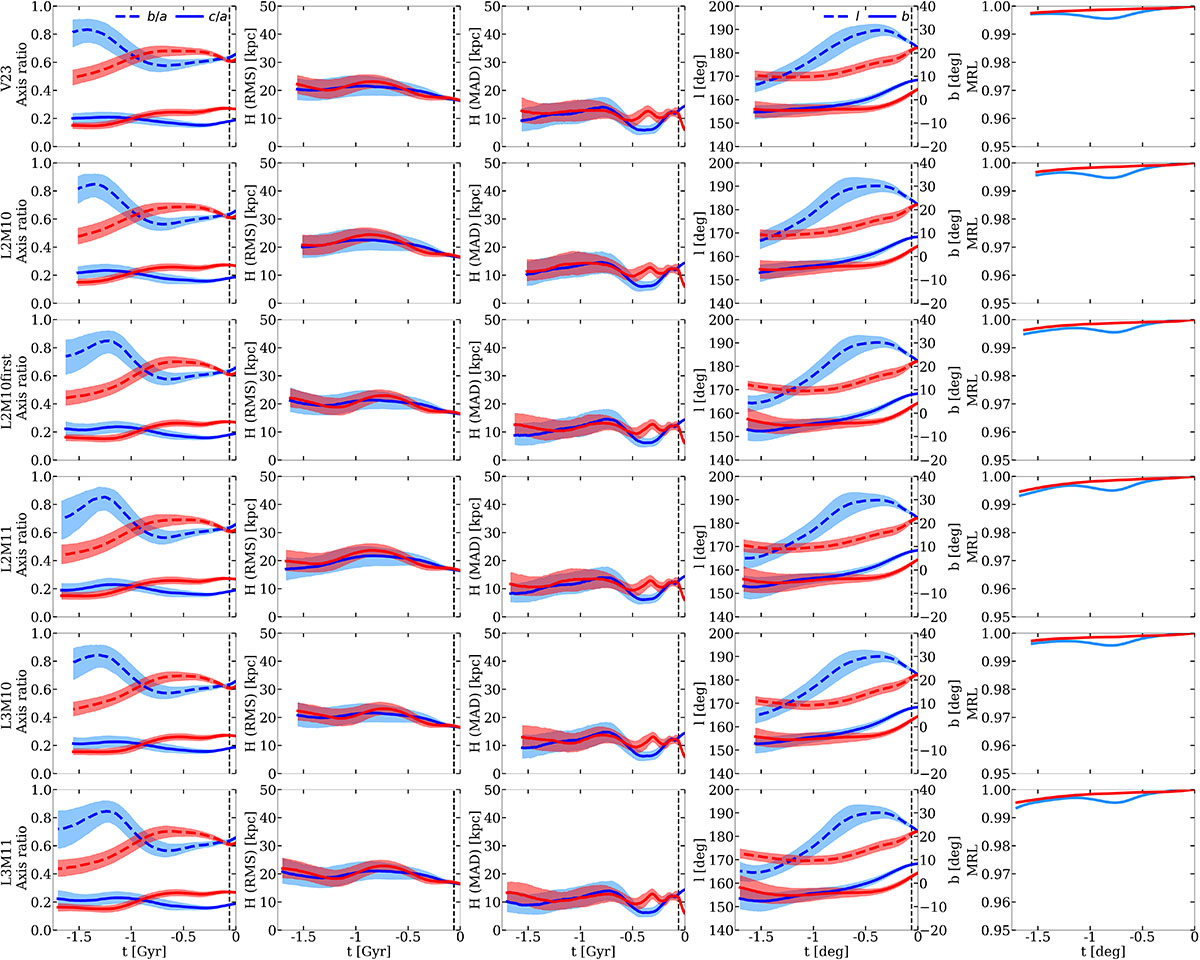
Fig. 5.
Download original image
Time evolution of the structural parameters of the VPOS measured from the MW on-plane satellites sample alone, and the MW and LMC on-plane satellites sample. The distribution of plots and markers coincides with Fig. 3, but the analysed time span is shorter, starting when the LMC gets within 250 kpc from the MW (see Section 3.2). Red lines and shaded areas represent the parameters of the VPOS measured with the MW+LMC on-plane satellite sample, blues one are for the MW sample only. Dashed vertical lines show the time at which the LMC performed its pericentre.
Current usage metrics show cumulative count of Article Views (full-text article views including HTML views, PDF and ePub downloads, according to the available data) and Abstracts Views on Vision4Press platform.
Data correspond to usage on the plateform after 2015. The current usage metrics is available 48-96 hours after online publication and is updated daily on week days.
Initial download of the metrics may take a while.