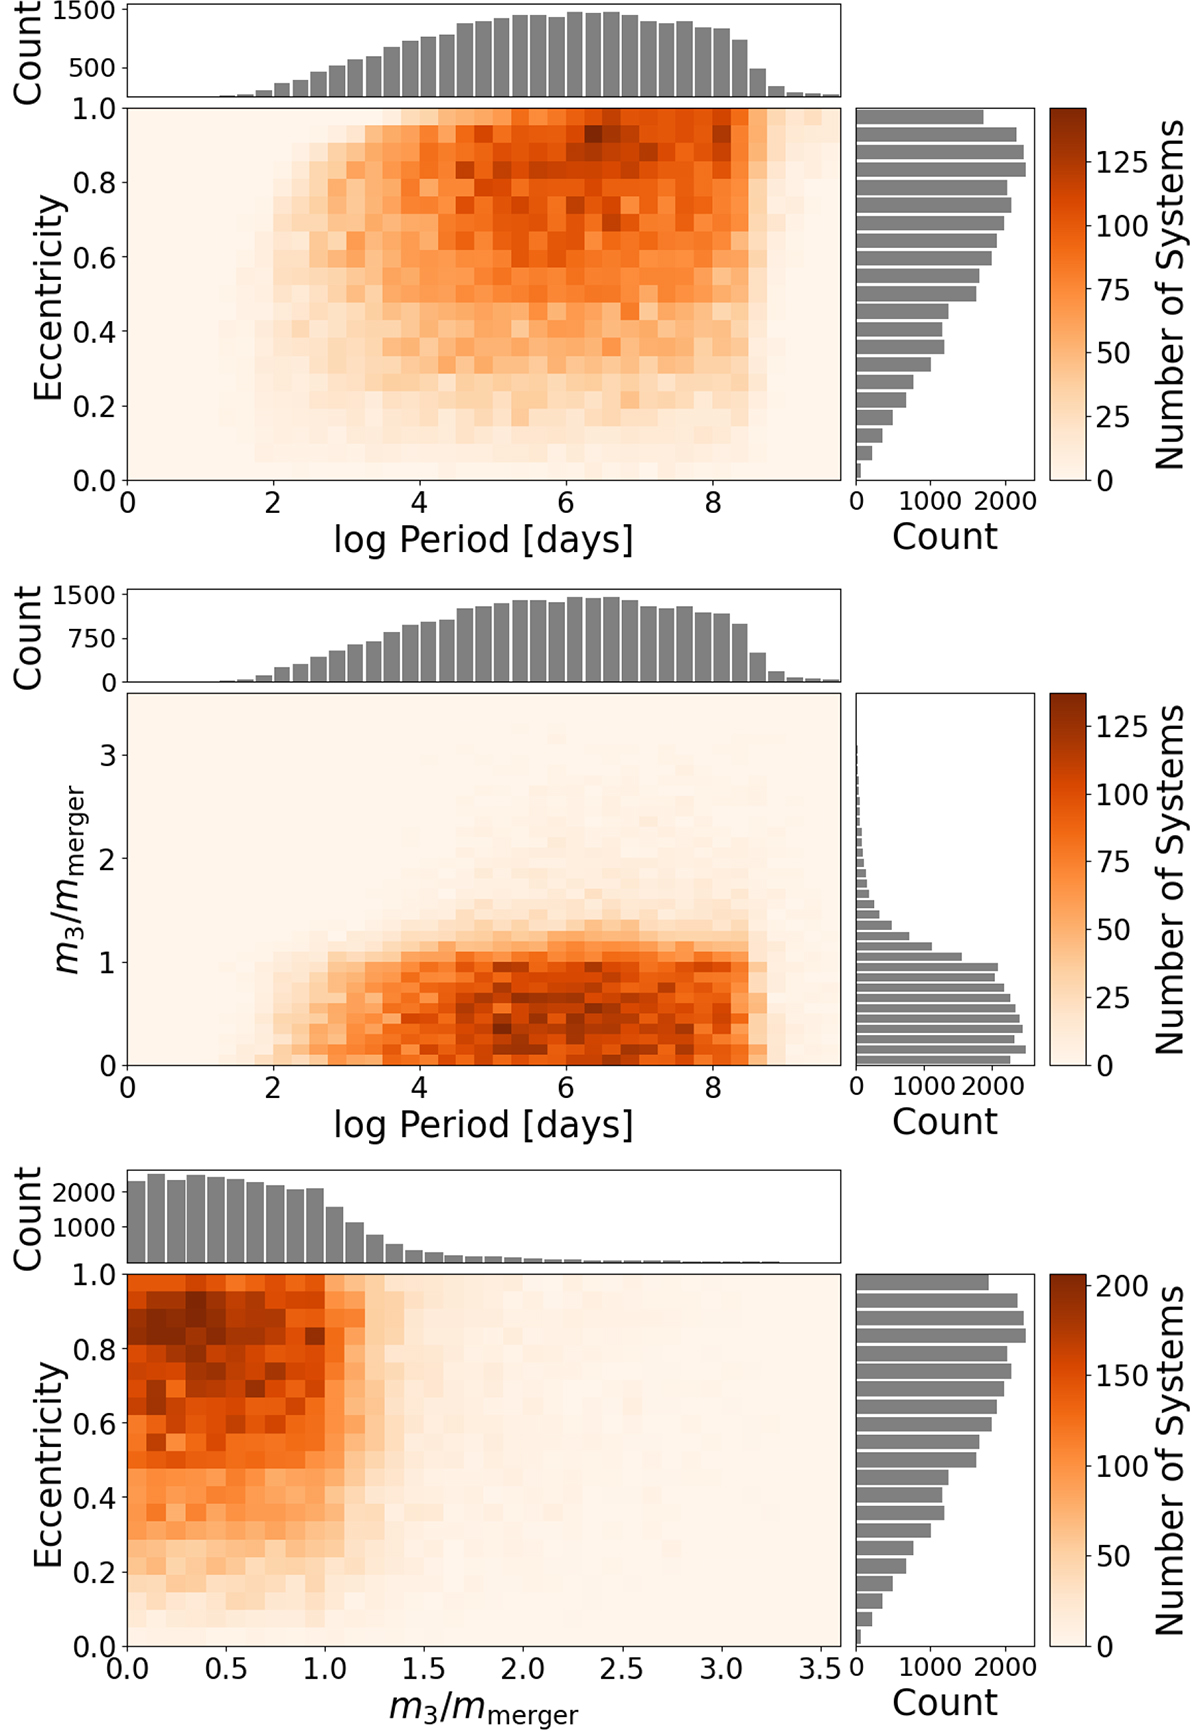
Fig. 4.
Download original image
2D histograms of the following post-merger orbital parameters: log orbital period (in days) vs eccentricity (top), log orbital period vs tertiary-to-merger-remnant mass ratio qpm (middle), and mass ratio vs eccentricity (bottom). Colour indicates the number of simulated systems in each bin, and histograms on top and side axes show the marginal distributions.
Current usage metrics show cumulative count of Article Views (full-text article views including HTML views, PDF and ePub downloads, according to the available data) and Abstracts Views on Vision4Press platform.
Data correspond to usage on the plateform after 2015. The current usage metrics is available 48-96 hours after online publication and is updated daily on week days.
Initial download of the metrics may take a while.