Open Access
Fig. C.1
Download original image
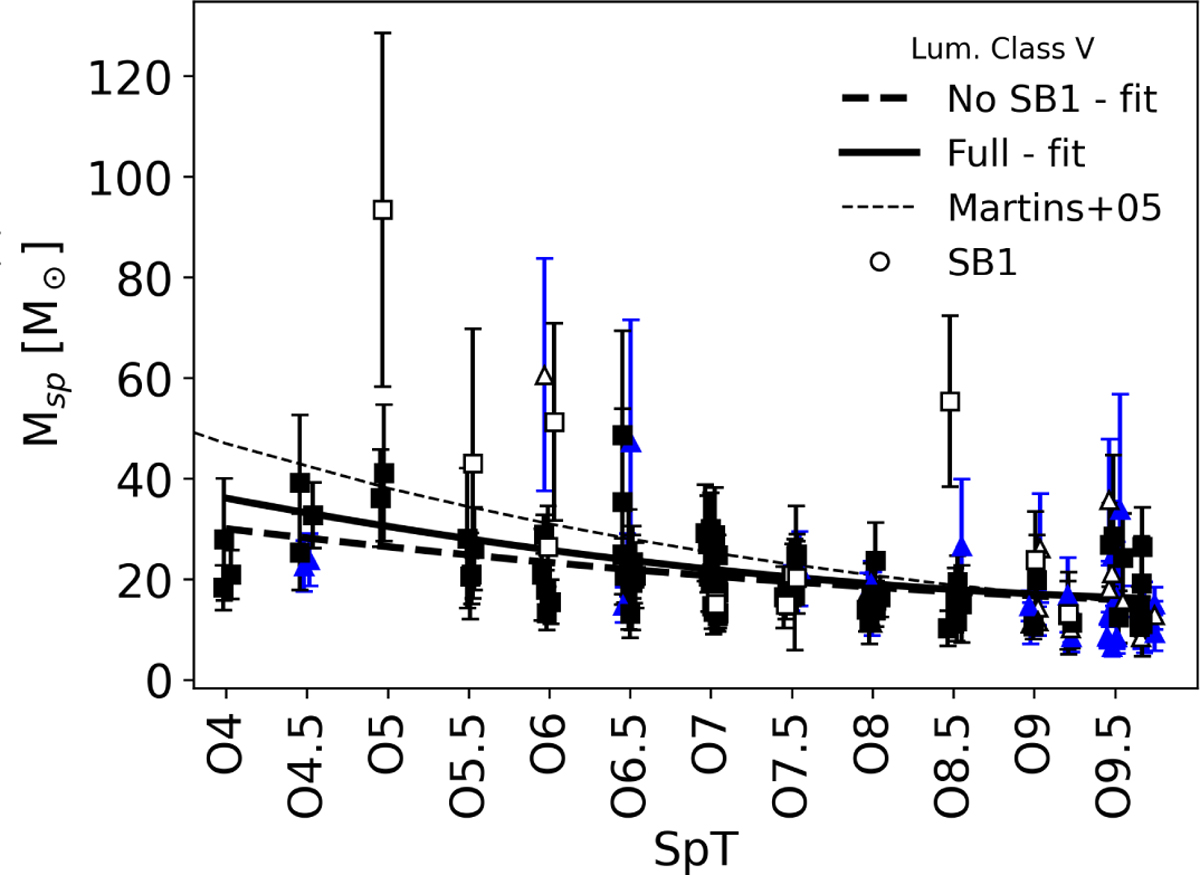
Similar to Fig. 7, panel bottom-right. Impact of SB1 stars (white symbols) on the spectroscopic mass calibration for LC V stars. The solid black line shows the polynomial fit derived from the full calibrator sample, including SB1 systems. The dashed line corresponds to the fit obtained after removing all SB1 stars.
Current usage metrics show cumulative count of Article Views (full-text article views including HTML views, PDF and ePub downloads, according to the available data) and Abstracts Views on Vision4Press platform.
Data correspond to usage on the plateform after 2015. The current usage metrics is available 48-96 hours after online publication and is updated daily on week days.
Initial download of the metrics may take a while.