Fig. 10
Download original image
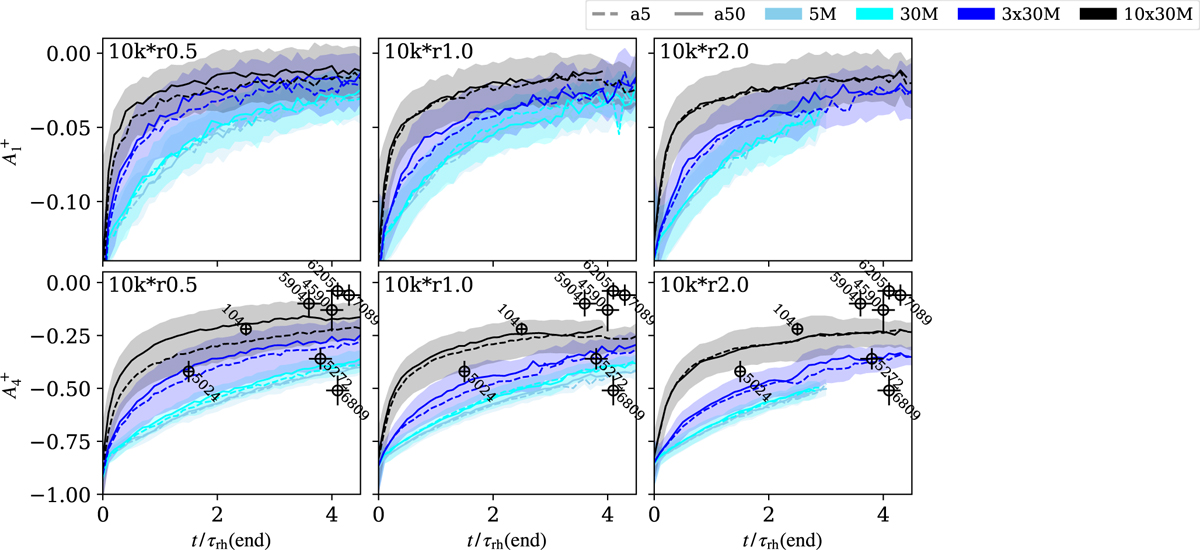
Time evolution of the parameter ![]() in the 10k-* clusters – the top row is for Rlim = 1 rh, the bottom one is for Rlim = 4 rh, see Eq. (16) for the definition. Only the models with the initial binary semi-major axis of 5 au (dashed lines) and 50 au (solid lines) are shown, averaged over all realisations of the models. The shaded area corresponds to their combined 1-sigma uncertainties. The
in the 10k-* clusters – the top row is for Rlim = 1 rh, the bottom one is for Rlim = 4 rh, see Eq. (16) for the definition. Only the models with the initial binary semi-major axis of 5 au (dashed lines) and 50 au (solid lines) are shown, averaged over all realisations of the models. The shaded area corresponds to their combined 1-sigma uncertainties. The ![]() data points of NGC clusters are taken from Leitinger et al. (2025) for comparison.
data points of NGC clusters are taken from Leitinger et al. (2025) for comparison.
Current usage metrics show cumulative count of Article Views (full-text article views including HTML views, PDF and ePub downloads, according to the available data) and Abstracts Views on Vision4Press platform.
Data correspond to usage on the plateform after 2015. The current usage metrics is available 48-96 hours after online publication and is updated daily on week days.
Initial download of the metrics may take a while.