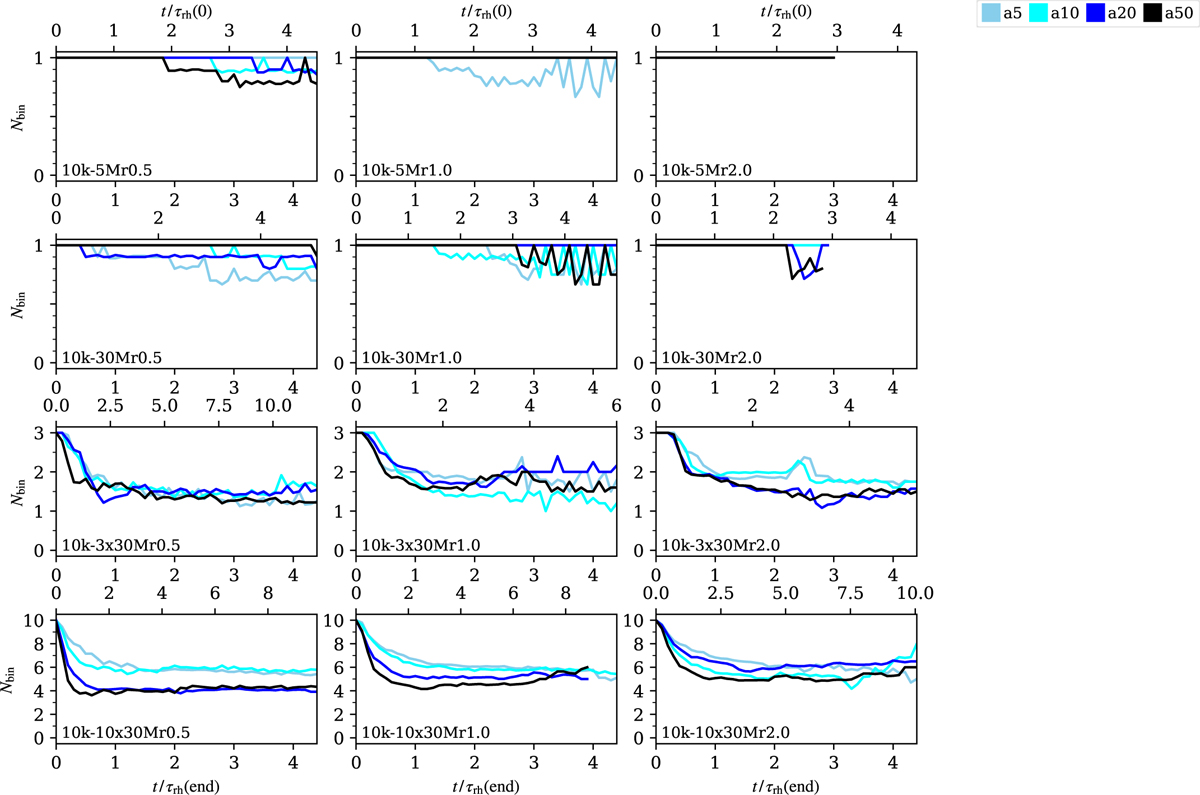
Fig. 4
Download original image
Number of massive binaries in each 10k-* model in time (averaged over each model’s realisations). The models are separated by their initial rh (columns), primordial binary systems (rows), and their semi-major axes (colours). In each plot, the top horizontal axis shows the evolutionary time in the initial half-mass relaxation times, and the lower horizontal axis is in multiples of τrh at the end of the simulation (to mimic the ‘present-day’ value). While we permit the dynamical formation of the low-mass (m3+m3) or mixed (m1,2+m3) binaries in the simulations, the numbers here only show the massive (m1+m2) binaries, including component switching. However, if the primordial binary goes through a state of an unstable triple, it is not counted towards Nbin (which is why we sometimes see the number of binaries decreasing and then increasing again).
Current usage metrics show cumulative count of Article Views (full-text article views including HTML views, PDF and ePub downloads, according to the available data) and Abstracts Views on Vision4Press platform.
Data correspond to usage on the plateform after 2015. The current usage metrics is available 48-96 hours after online publication and is updated daily on week days.
Initial download of the metrics may take a while.