Fig. 8
Download original image
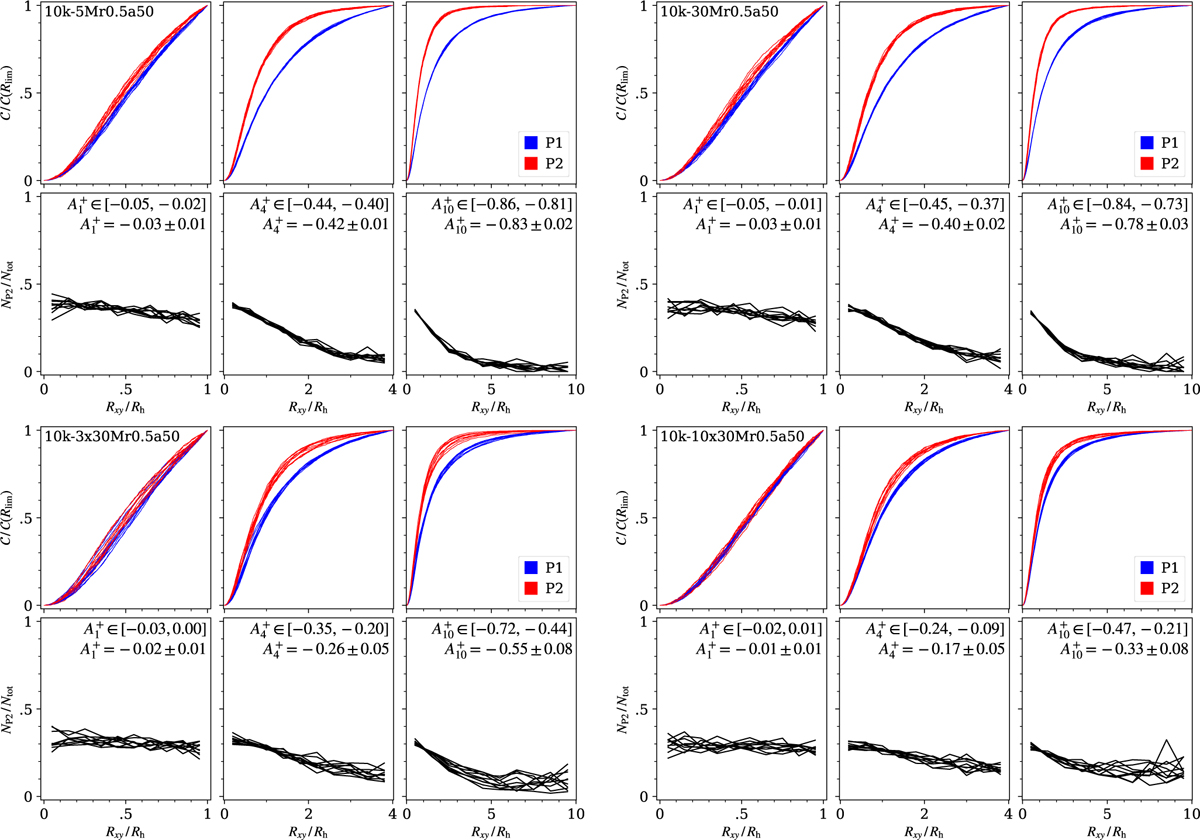
Selected 10k-* models with the highest A+ at 4 τrh for each primordial binary set-up (as labelled in the top left corners). Top panels: normalised projected cumulative radial distributions of stars in two populations (P1 and P2 – distinguished by colours) in the clusters, calculated from Eq. (16). All realisations of the corresponding model are plotted. Columns correspond to different values of Rlim. Bottom panels: the ratio of P2 stars in several radial bins (similarly to Leitinger et al. 2023). Each model realisation is plotted with a black line. The parameter ![]() (its maximum range and median with standard deviation) is also displayed for each region.
(its maximum range and median with standard deviation) is also displayed for each region.
Current usage metrics show cumulative count of Article Views (full-text article views including HTML views, PDF and ePub downloads, according to the available data) and Abstracts Views on Vision4Press platform.
Data correspond to usage on the plateform after 2015. The current usage metrics is available 48-96 hours after online publication and is updated daily on week days.
Initial download of the metrics may take a while.