Fig. 3
Download original image
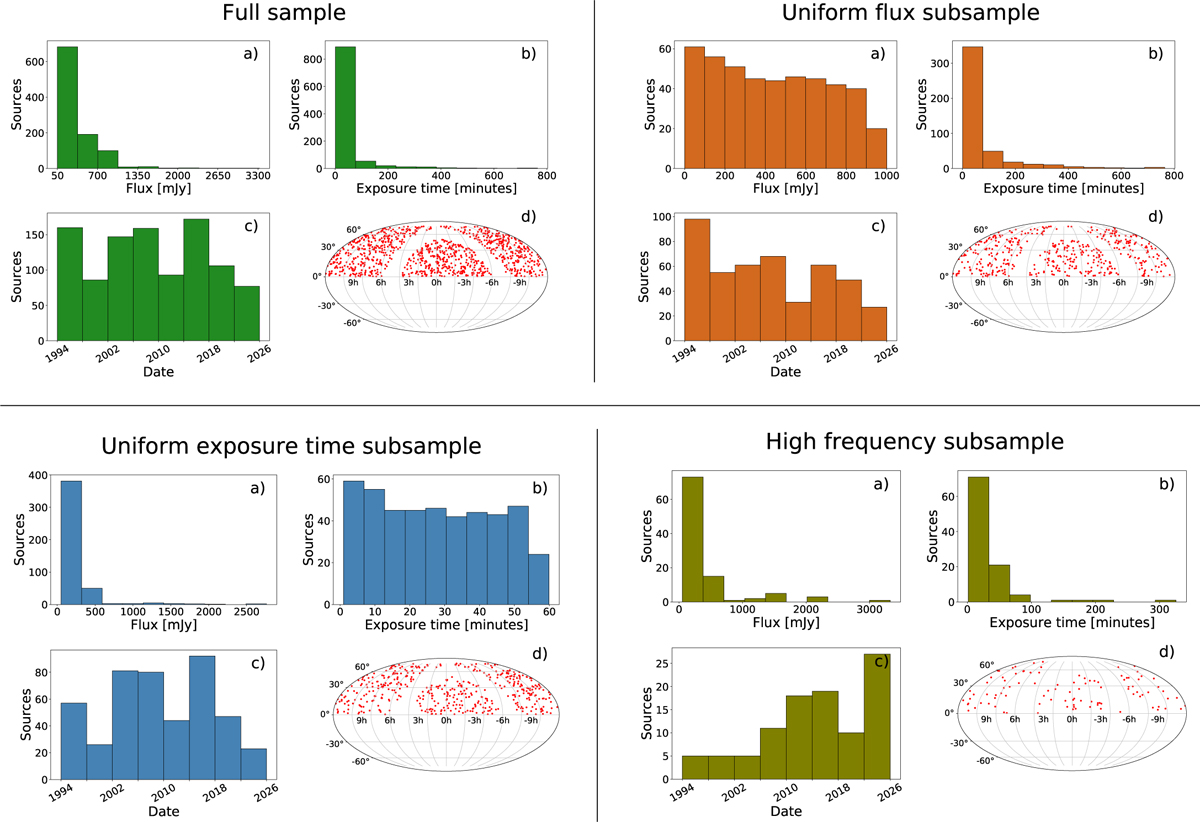
Properties of the VLBA test sample used in this study. Each panel corresponds to a different subsample: Top left: full sample of 1000 sources. Top right: subsample uniformly distributed in (VLA) flux (450 sources). Bottom left: subsample uniformly distributed in exposure time (450 sources). Bottom right: subsample randomly selected from observations at 15 and 22 GHz (100 sources). Each panel contains four subplots: (a) Histogram of source fluxes at 8.4 GHz from VLA observations of the CLASS survey (Myers et al. 2003). (b) Histogram of on-target exposure times, (c) Distribution of observation dates, (d) Sky distribution in equatorial coordinates.
Current usage metrics show cumulative count of Article Views (full-text article views including HTML views, PDF and ePub downloads, according to the available data) and Abstracts Views on Vision4Press platform.
Data correspond to usage on the plateform after 2015. The current usage metrics is available 48-96 hours after online publication and is updated daily on week days.
Initial download of the metrics may take a while.