Fig. 6
Download original image
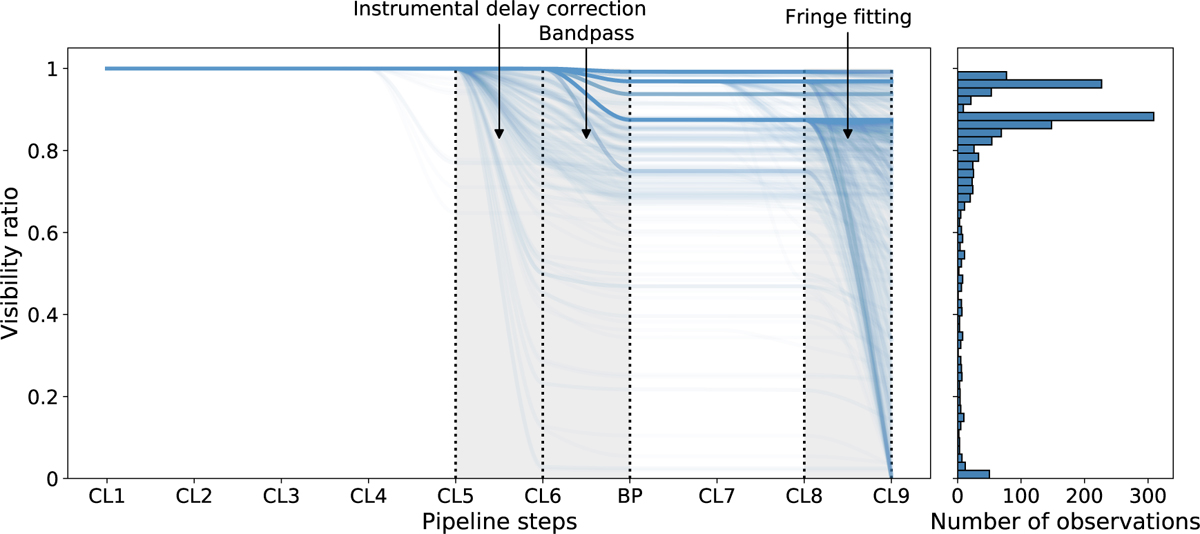
Visibility ratio across the calibration pipeline for 1372 VLBA observations. The left panel shows, for each observation, the visibility ratio at each major calibration stage. Each semi-transparent line represents a single observation, so darker regions correspond to a higher density of observations. The most significant drops are highlighted in gray. They correspond to the instrumental delay correction (CL5 to CL6), bandpass calibration, and the final fringe fitting on science targets (CL8 to CL9). The right panel shows the distribution of final visibility ratios after the full pipeline.
Current usage metrics show cumulative count of Article Views (full-text article views including HTML views, PDF and ePub downloads, according to the available data) and Abstracts Views on Vision4Press platform.
Data correspond to usage on the plateform after 2015. The current usage metrics is available 48-96 hours after online publication and is updated daily on week days.
Initial download of the metrics may take a while.