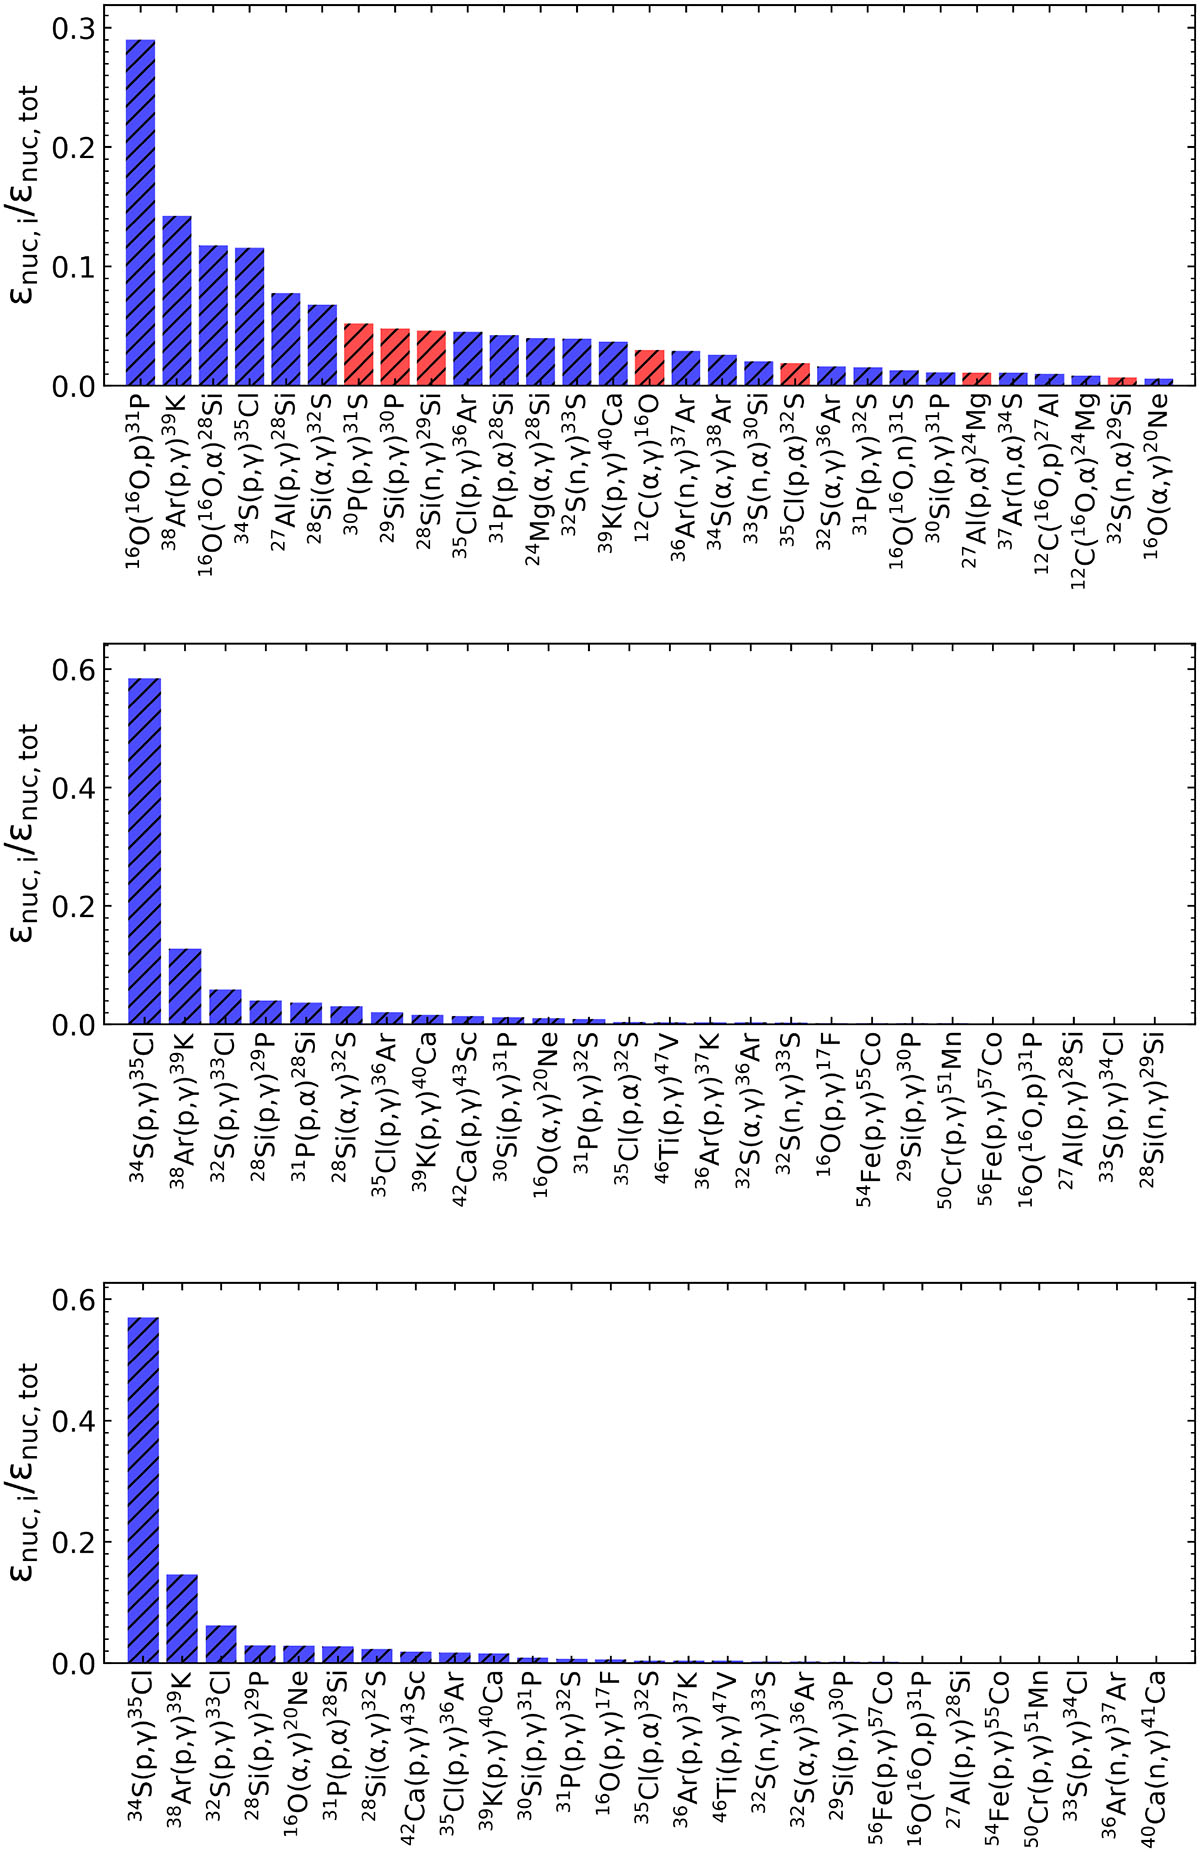
Fig. 1.
Download original image
Relative contribution of individual effective nuclear reactions (forward minus reverse reaction; see text) to the total nuclear energy production at the bottom of the O-burning shell during O shell burning (upper panel), at the beginning of the C–O shell merger (central panel), and at the end of the C–O shell merger (lower panel). The blue bars represent processes that are dominated by the forward reaction and have a positive energy contribution, while the red bars represent processes that are dominated by the reverse reaction and have a negative energy contribution. The three panels include all the reactions having an absolute ε/εtot > 10−3 (see also Tables A.3, A.4, and A.5).
Current usage metrics show cumulative count of Article Views (full-text article views including HTML views, PDF and ePub downloads, according to the available data) and Abstracts Views on Vision4Press platform.
Data correspond to usage on the plateform after 2015. The current usage metrics is available 48-96 hours after online publication and is updated daily on week days.
Initial download of the metrics may take a while.