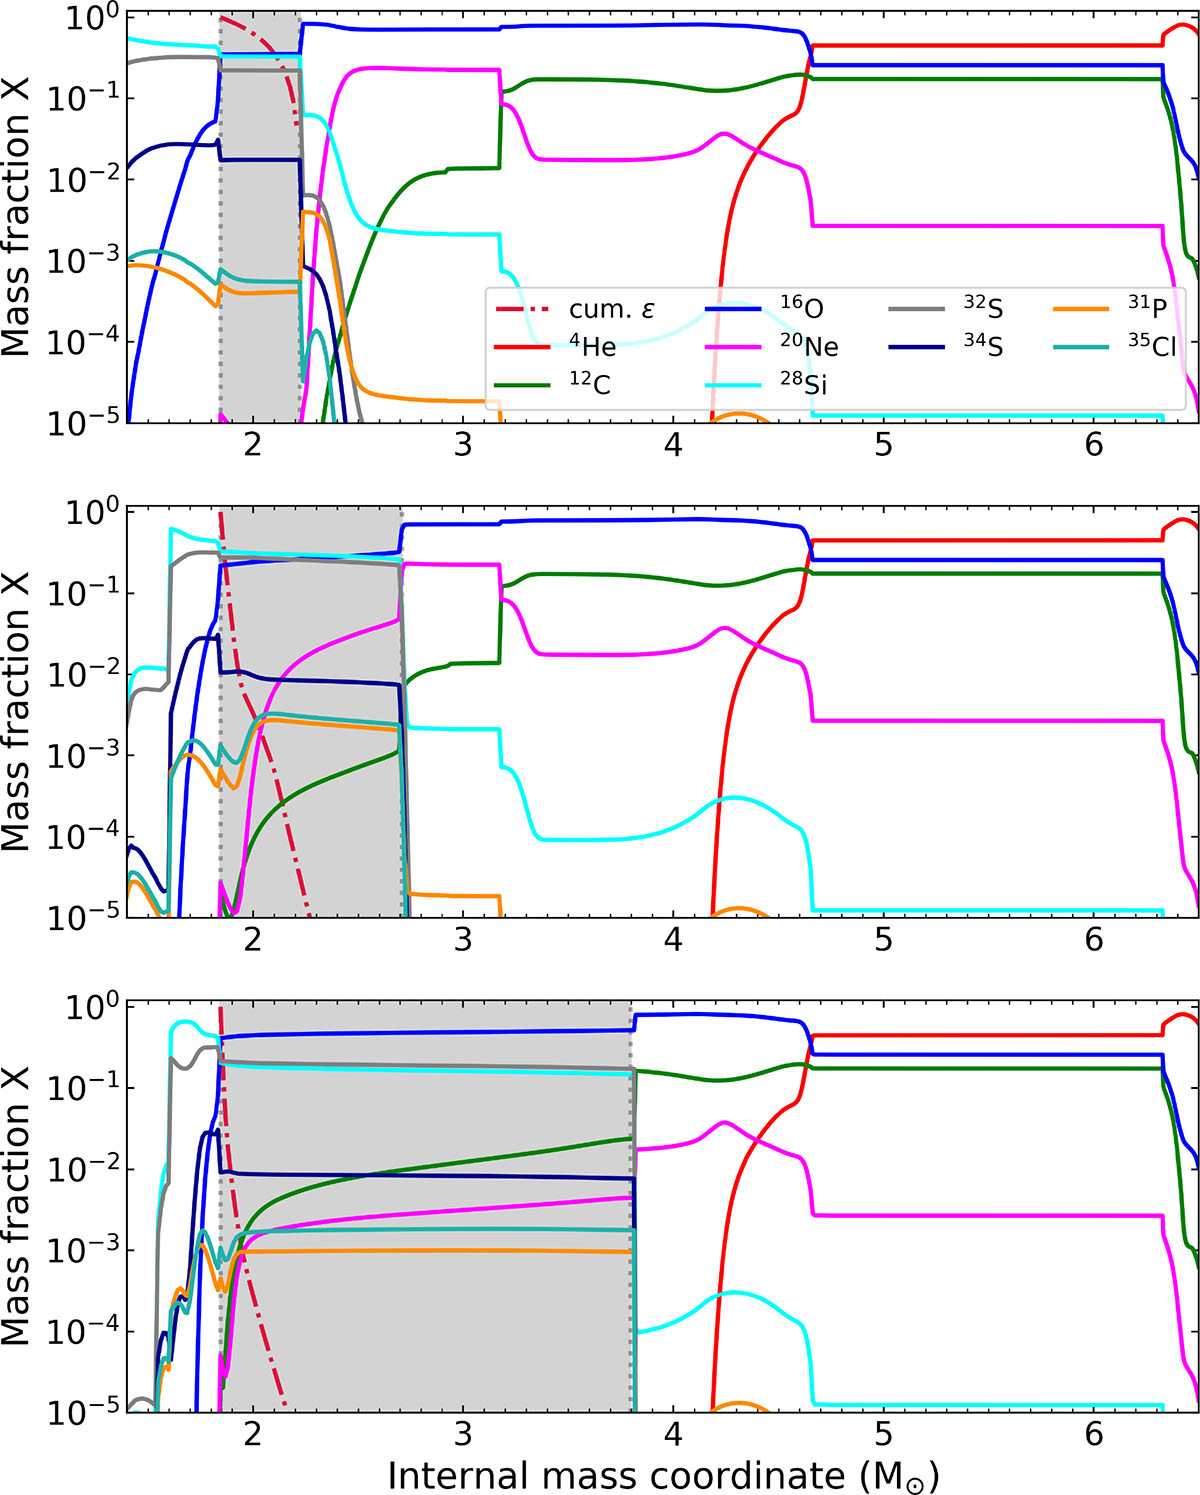
Fig. A.1.
Download original image
Abundances in mass fraction as a function of the internal mass coordinate for key nuclear species (see legend). The gray shaded area represents the O convective shell 3.47 × 10⁵ s (upper panel), 6.66 × 10³ s (central panel), and 5.72 × 10² s (lower panel) before the core-collapse. Neutron and proton abundances (not shown in the figure) with other relevant species are provided at these different stages in Table A.2, at the base of the gray zone. The dot-dashed red line shows the cumulative integral of the energy per second generated by the nuclear reactions from the outer edge to the bottom of the O shell normalized to its maximum.
Current usage metrics show cumulative count of Article Views (full-text article views including HTML views, PDF and ePub downloads, according to the available data) and Abstracts Views on Vision4Press platform.
Data correspond to usage on the plateform after 2015. The current usage metrics is available 48-96 hours after online publication and is updated daily on week days.
Initial download of the metrics may take a while.