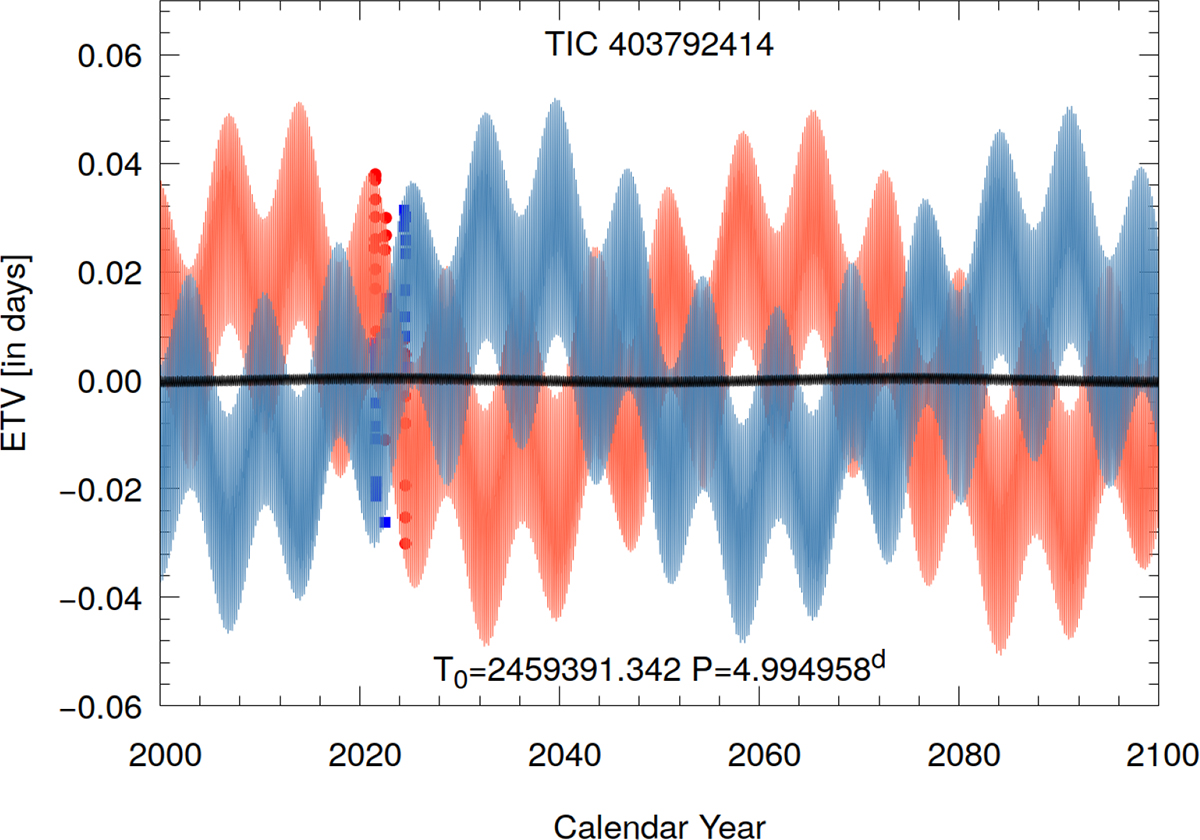
Fig. E.1.
Download original image
Numerically generated ETV curves for TIC 403792414 spanning the current century. The red and blue curves represent the numerically calculated ETV curves. The ETV points derived from the TESS eclipse observations are plotted with red circles and blue squares. The black curve around the zero ETV level indicates the pure LTTE contribution. The hugely uneven nature of the apsidal motion is clearly visible. See the text for further details.
Current usage metrics show cumulative count of Article Views (full-text article views including HTML views, PDF and ePub downloads, according to the available data) and Abstracts Views on Vision4Press platform.
Data correspond to usage on the plateform after 2015. The current usage metrics is available 48-96 hours after online publication and is updated daily on week days.
Initial download of the metrics may take a while.