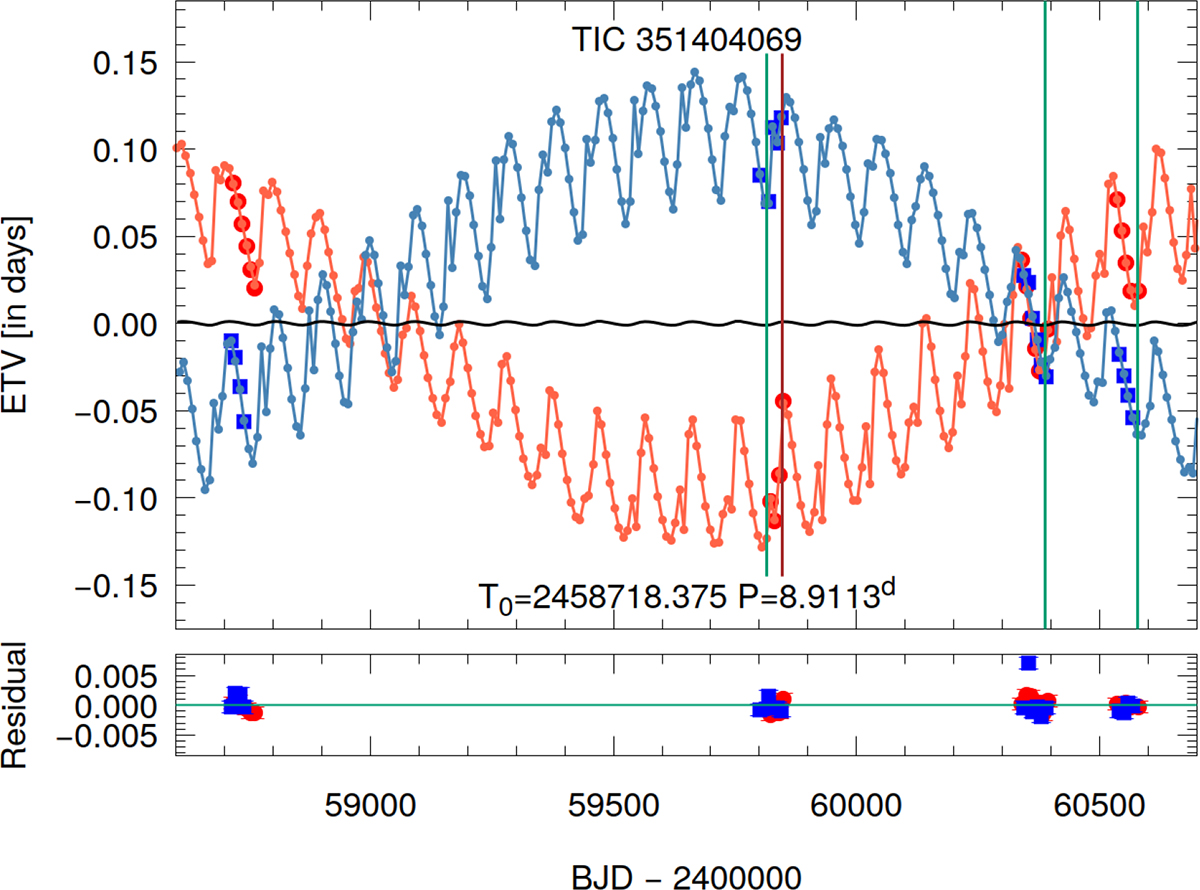
Fig. 2.
Download original image
Primary and secondary ETV curves (red and blue circles, respectively) formed from the TESS observations with the best-fit photodynamical solution for TIC 351404069 (see Sect. 5). The dynamically forced, rapid apsidal motion of the inner, eccentric EB is clearly visible. (It is important to be aware of the huge amplitude of the ETV.) The horizontally centred black curve represents the pure LTTE contribution. Vertical lines mark the times of the observed outer eclipses (green – the binary occulting the tertiary star and brown – vice versa).
Current usage metrics show cumulative count of Article Views (full-text article views including HTML views, PDF and ePub downloads, according to the available data) and Abstracts Views on Vision4Press platform.
Data correspond to usage on the plateform after 2015. The current usage metrics is available 48-96 hours after online publication and is updated daily on week days.
Initial download of the metrics may take a while.