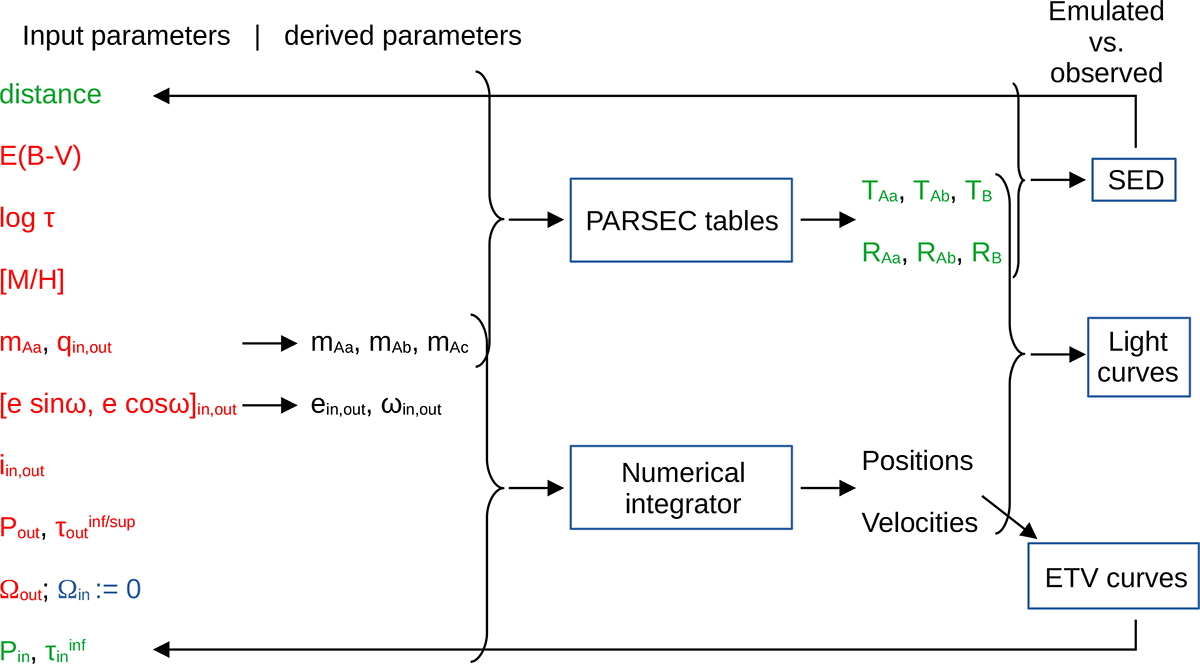
Fig. 3.
Download original image
Schematic flow chart of the entire photodynamical fitting process. Parameters marked in red font give those input parameters that are allowed to adjust during each MCMC trial step. Green symbols stand for the constrained quantities, while the black symbols denote quantities derived directly from the (adjustable, red) input parameters just at the beginning of each trial step and used during the subsequent part of the given step. The other quantities, not shown in the chart, but listed in the result tables below are computed a posteriori, at the end of the entire photodynamical analysis process. Note also, the only parameter with fixed input value (Ωin = 0) is given in blue font. (For the meaning of each symbol, see Table B.1.)
Current usage metrics show cumulative count of Article Views (full-text article views including HTML views, PDF and ePub downloads, according to the available data) and Abstracts Views on Vision4Press platform.
Data correspond to usage on the plateform after 2015. The current usage metrics is available 48-96 hours after online publication and is updated daily on week days.
Initial download of the metrics may take a while.