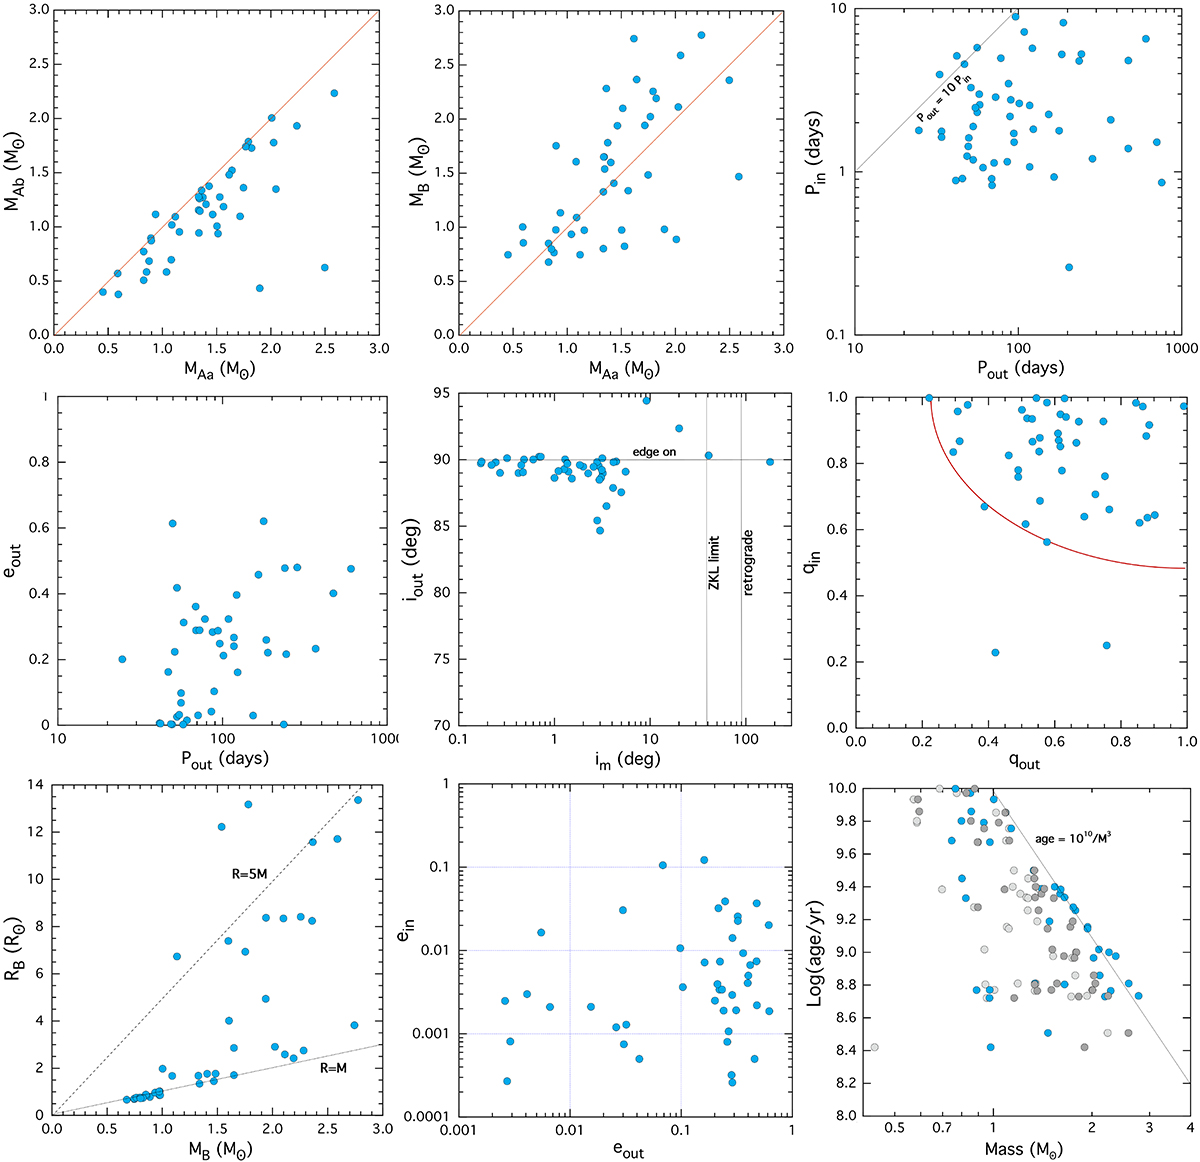
Fig. 4.
Download original image
Statistical plots for properties of 44 triply eclipsing triples uniformly analysed (see text for references). Top-row panels:MAb vs. MAa, MB vs. MAa, and Pin vs. Pout. Middle-row panels:eout vs. Pout, iout vs. imut, and qin vs. qout. Bottom-row panels:RB vs. MB, ein vs. eout, and the age of the systems vs. the masses of the tertiary (blue), primary (dark grey), and secondary (light grey) EB stars. In this latter panel as well as the first two panels, the masses of TIC 290061484 are ∼7 M⊙ and they are off the plots. The red curve in the middle right panel shows how nearly all the systems are confined to 0.2 < qout < 1.0 and qin > 0.2. In the central panel, the vertical lines denote the transition to the Von Zeipel-Lidov-Kozai (ZLK) cycles (see Naoz 2016, for a review), and to retrograde orbits, respectively. The sloped dashed lines in the lower left panel are for RB = 1 MB and =5 MB (both expressed in solar units), as rough guides of unevolved and quite evolved stars, respectively.
Current usage metrics show cumulative count of Article Views (full-text article views including HTML views, PDF and ePub downloads, according to the available data) and Abstracts Views on Vision4Press platform.
Data correspond to usage on the plateform after 2015. The current usage metrics is available 48-96 hours after online publication and is updated daily on week days.
Initial download of the metrics may take a while.