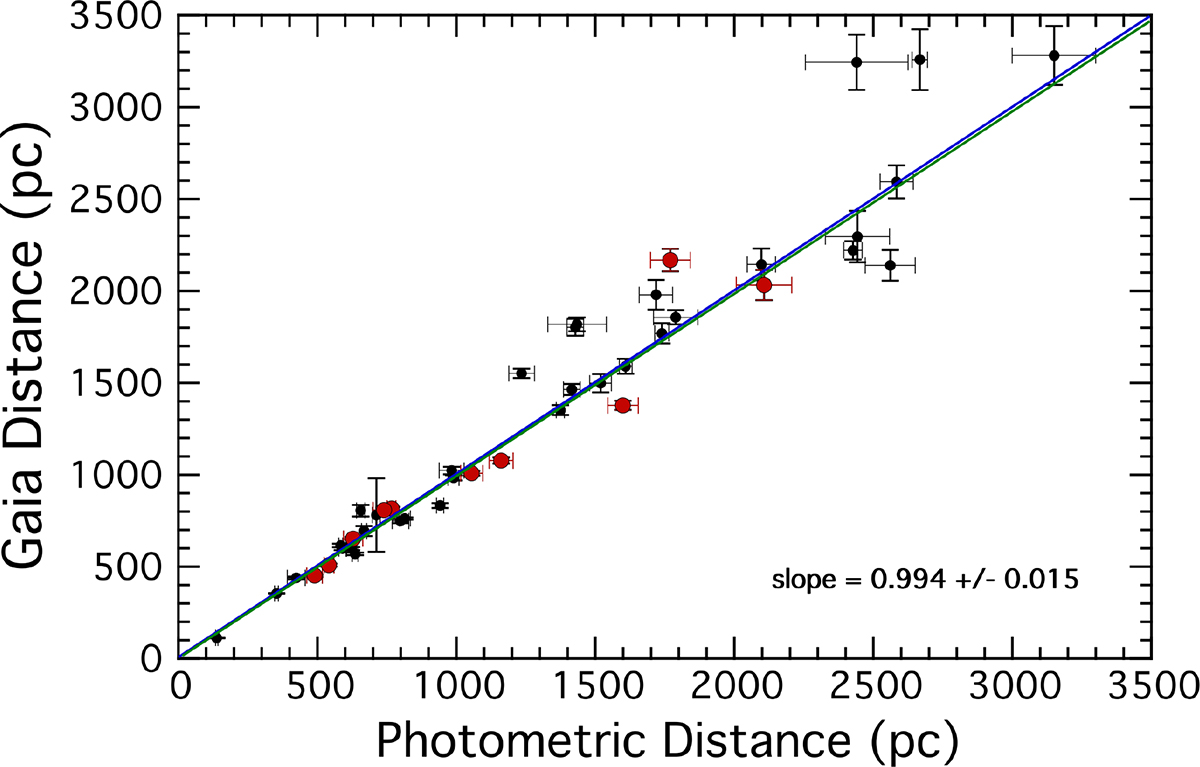
Fig. 7.
Download original image
Comparison of Gaia distances (Bailer-Jones et al. 2021) to 43 triple systems with distances found from our photodynamical fits to the system parameters. The systems marked in red are the 10 from the current work with fitted distances. The blue curve is the line where the Gaia and our photometric distances would match. The green curve results from a formal orthogonal distance regression with a fitted slope of 0.994 ± 0.015. There are three systems not shown. For TIC 388459317 and TIC 52041148, the Gaia points are off the plot and have rather large uncertainties compared to the photometric ones. TIC 280883908 has dGaia = 3072 ± 1000 pc compared to dphoto = 1183 ± 40 pc, where the Gaia point is quite obviously not very good, and its presence on the plot with such a large error bar would be visually distracting.
Current usage metrics show cumulative count of Article Views (full-text article views including HTML views, PDF and ePub downloads, according to the available data) and Abstracts Views on Vision4Press platform.
Data correspond to usage on the plateform after 2015. The current usage metrics is available 48-96 hours after online publication and is updated daily on week days.
Initial download of the metrics may take a while.