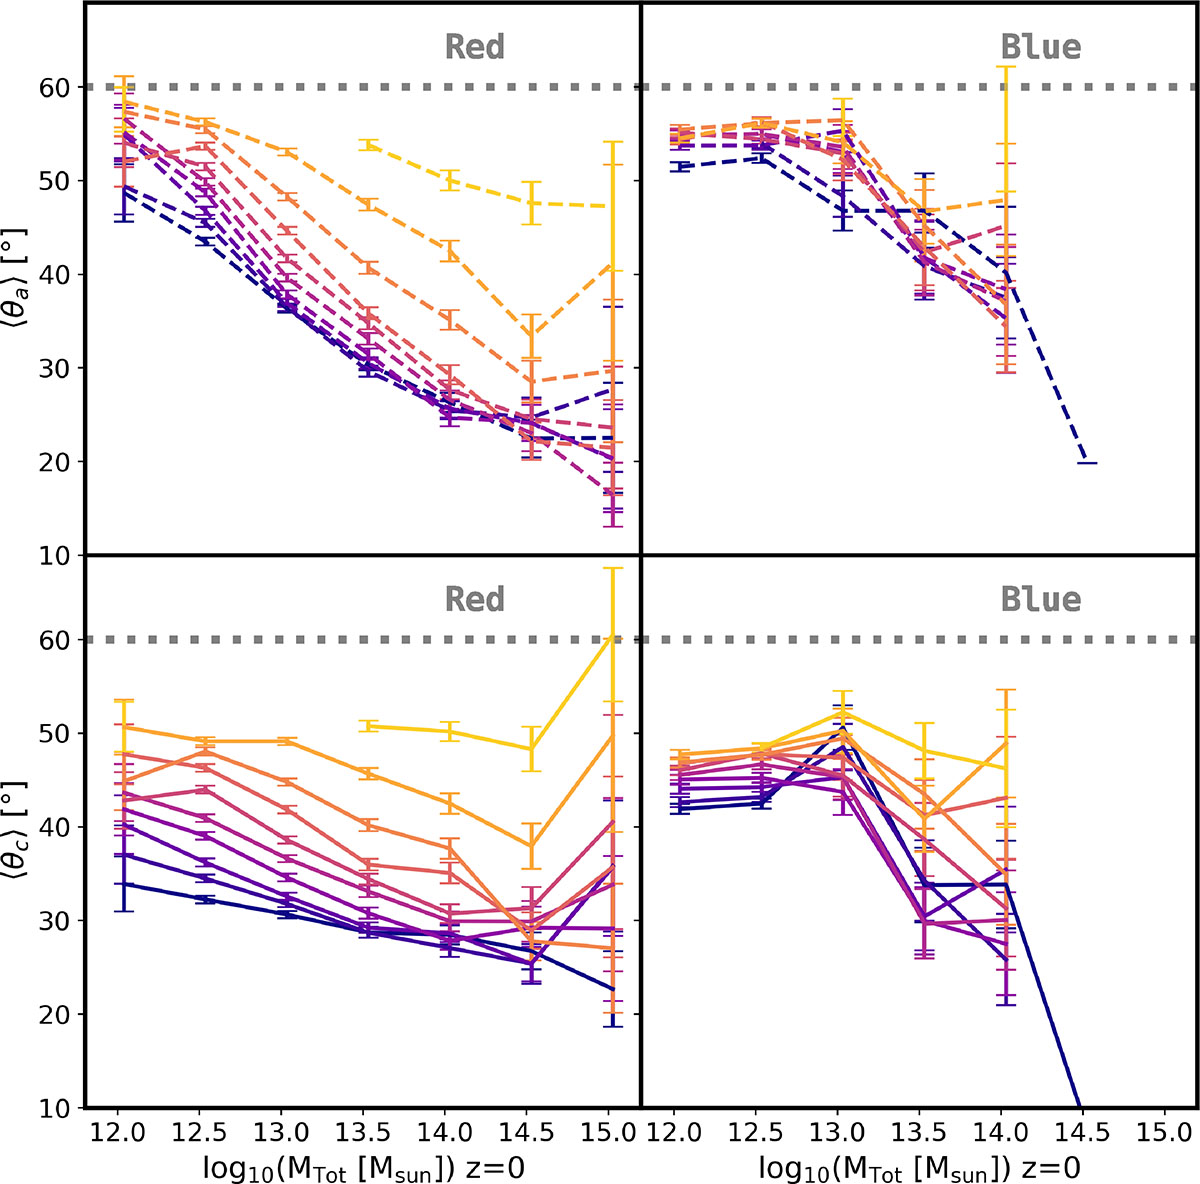
Fig. 2.
Download original image
Evolution of the average misalignment angles θa (upper panels) and θc (lower panels) of the stellar and dark matter major and minor axes respectively, as a function of total mass. Left panels show the evolution of the alignments of BGGs that are classified as red at z = 0, i.e (g − r)z = 0 > 0.6, while the right panels show the evolution of blue BGGs i.e (g − r)z = 0 < 0.6.
Current usage metrics show cumulative count of Article Views (full-text article views including HTML views, PDF and ePub downloads, according to the available data) and Abstracts Views on Vision4Press platform.
Data correspond to usage on the plateform after 2015. The current usage metrics is available 48-96 hours after online publication and is updated daily on week days.
Initial download of the metrics may take a while.