Open Access
Fig. 3.
Download original image
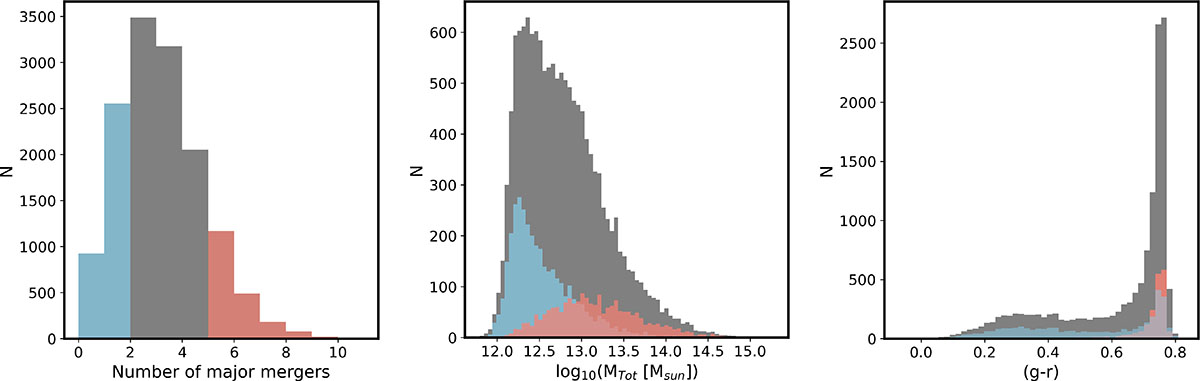
Left, middle, and right panels illustrate the histogram of the number of major mergers from z = 15 to z = 0, total mass and color, respectively, for the entire sample of BGGs shown in grey. In light blue we select the galaxies that had 1 or 0 major mergers and in pink those that had 5 or more major mergers.
Current usage metrics show cumulative count of Article Views (full-text article views including HTML views, PDF and ePub downloads, according to the available data) and Abstracts Views on Vision4Press platform.
Data correspond to usage on the plateform after 2015. The current usage metrics is available 48-96 hours after online publication and is updated daily on week days.
Initial download of the metrics may take a while.