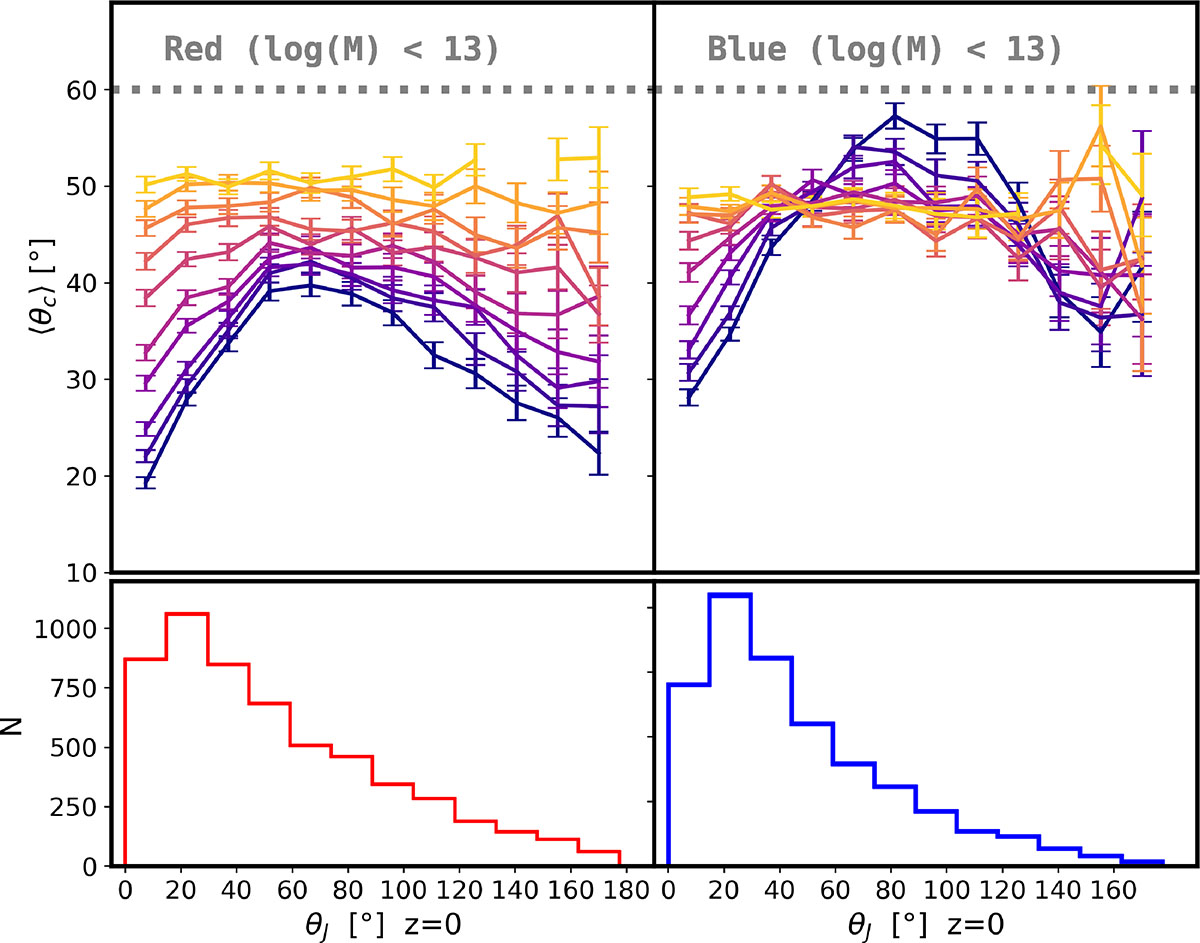
Fig. 8.
Download original image
Upper panels show the evolution of the average misalignment angle θc between the stellar and dark matter minor axis as a function of their θJ alignment at z = 0, for red (left panel) and blue (right panel) BGGs within the mass range MTot < 1013 M⊙. The grey dotted line on the upper panels indicates an average angle of 90°, corresponding to random orientation. The lower panels illustrate the distribution of θJ for red (left panel) and blue (right panel) BGGs within that same mass range.
Current usage metrics show cumulative count of Article Views (full-text article views including HTML views, PDF and ePub downloads, according to the available data) and Abstracts Views on Vision4Press platform.
Data correspond to usage on the plateform after 2015. The current usage metrics is available 48-96 hours after online publication and is updated daily on week days.
Initial download of the metrics may take a while.