Fig. 10.
Download original image
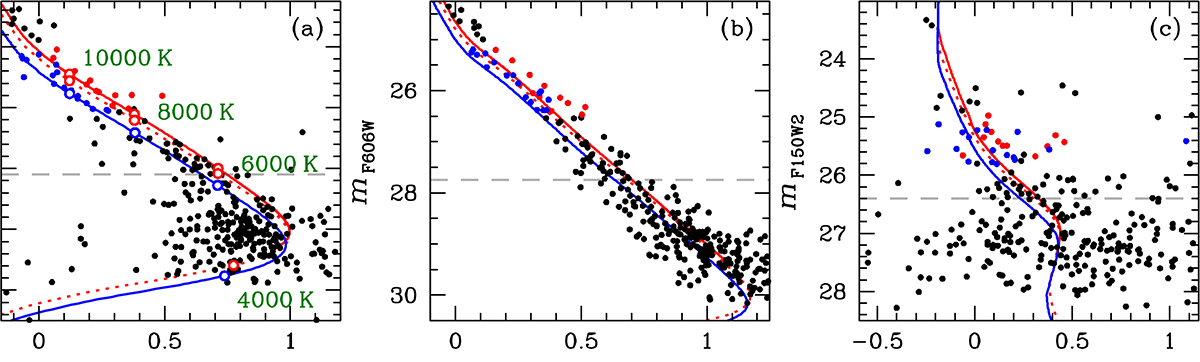
Comparison of the observed WD CS and theoretical cooling tracks. (a): mF814W versus mF814W − mF150W2 CMD. (b): mF606W versus mF606W − mF814W CMD. (c): mF150W2 versus mF150W2 − mF322W2 CMD. In all panels, red and blue points represent the bWD and rWD populations identified in Fig. 8a, respectively. The solid and dotted red lines show the cooling tracks of 0.46 M⊙ He-core and CO-core WDs, respectively. The solid blue line shows the cooling track of a 0.54 M⊙ CO-core WD. In panel (a), selected effective temperatures are indicated along the tracks. In each panel, the horizontal dashed grey line marks the magnitude below which the two sequences can no longer be separated, as their colour difference becomes comparable to the photometric errors.
Current usage metrics show cumulative count of Article Views (full-text article views including HTML views, PDF and ePub downloads, according to the available data) and Abstracts Views on Vision4Press platform.
Data correspond to usage on the plateform after 2015. The current usage metrics is available 48-96 hours after online publication and is updated daily on week days.
Initial download of the metrics may take a while.